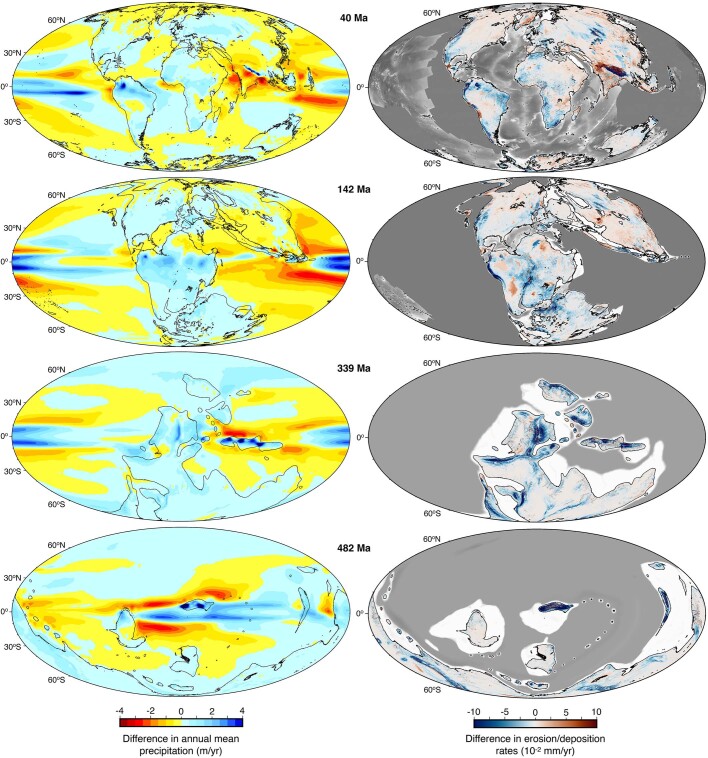
Extended Data Fig. 7. Influence of paleo-precipitation scenarios on spatial distribution of denudation rates.
Differences in annual mean precipitation between the Phanerozoic paleo-climate model of Li et al.93 and the one from Valdes et al.15 using the CO2 curve from Foster et al.68 are presented on the left (drier predictions in Li et al.93 range from yellow to red and wetter ones from cyan to dark blue). Simulated differences in erosion and deposition rates between the two scenarios using goSPL12 show higher erosion with the Li et al.93 simulation in blue and higher deposition in red.

