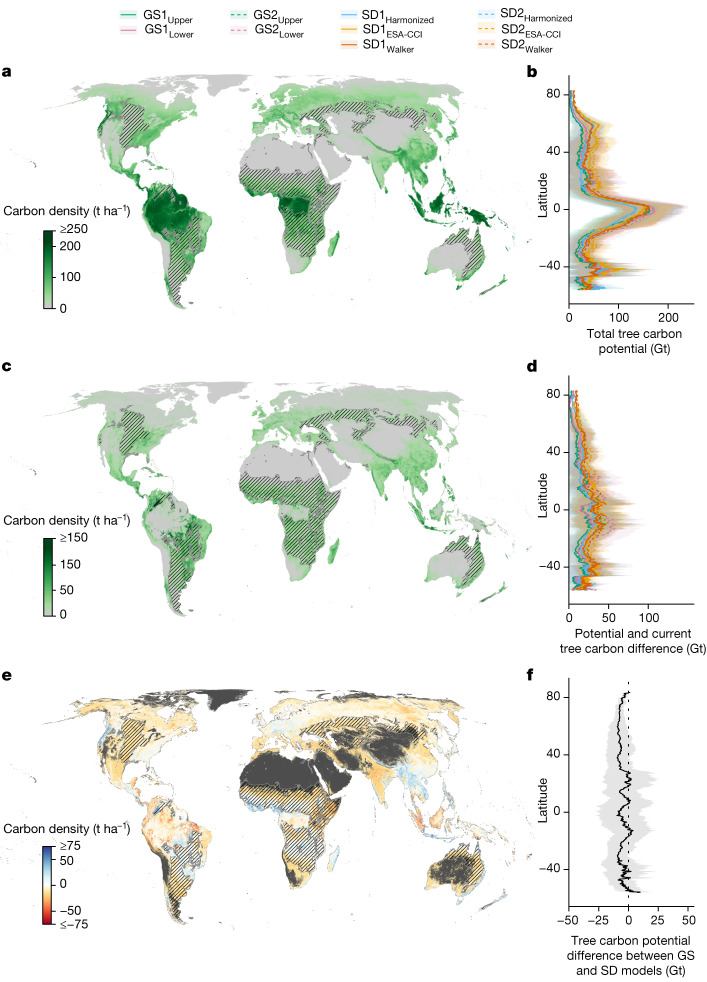
Fig. 2. The natural tree carbon potential under current climate conditions in the absence of humans.
a,b, The total living tree carbon potential of 600 Gt C within the natural canopy cover area of 4.4 billion ha2. c,d, The differences between current and potential tree carbon stocks, totalling 217 Gt C. e,f, The difference of tree carbon potential between the GS and SD models, subtracting the mean values of the six SD models from the mean values of the four GS models. Blue colours indicate that the GS models predict higher potential than the SD models, whereas red colours indicate the opposite. b,d,f, Latitudinal distributions (mean ± standard deviation) of the total tree carbon potential for the GS1, GS2, SD1 and SD2 models (b), the difference between current and potential tree carbon (d) and the difference of tree carbon potential between the GS and SD models (f). Maps represent the average estimates across all GS and SD models and are projected at 30-arcsec (about 1-km2) resolution. We show dryland and savannah biomes with stripes to denote that many of these areas are not appropriate for forest restoration. Where trees would naturally exist, they often exist far below 100% canopy cover, and restoration of forest cover should be limited to natural conditions.

