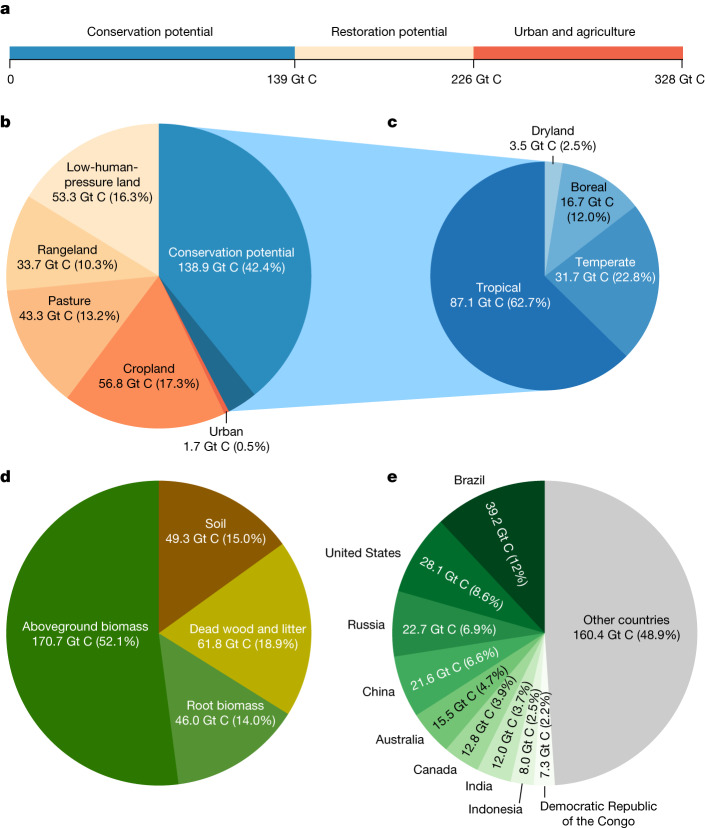
Fig. 5. Contribution of land-use types, forest types, carbon pools and countries to the difference between current and potential ecosystem-level carbon stocks.
a, Of the 328 Gt C discrepancy between current and potential carbon stocks, 226 Gt C is found outside urban and agricultural (cropland and pasture) areas, with 61% in forested regions in which the recovery of degraded ecosystems can promote carbon capture (conservation potential) and 39% in regions in which forests have been removed (restoration potential). b, Relative contribution of forest degradation (conservation potential; blue area) and land-cover change (orange colours) to the difference between current and potential ecosystem-level carbon stocks. The darker blue area represents the conservation potential of 10.5 Gt C in forest plantation regions. c, Relative contribution of tropical, temperate, boreal and dryland forests to the total forest conservation potential. d, Relative contribution of the three main carbon pools (living biomass, dead wood and litter, and soil) to the difference between current and potential carbon stocks. e, The nine countries contributing more than 50% to the difference between current and potential carbon stocks.

