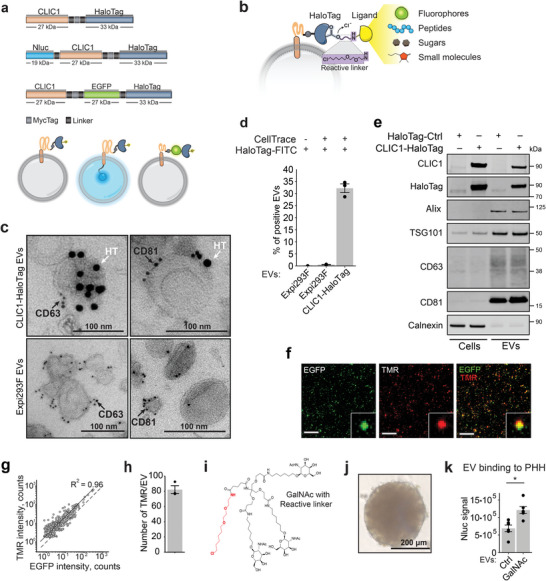
Figure 2.

HaloTag enables a versatile and modular display of multiple targeting ligands on the surface of EVs. a) EV engineering construct design and the protein display topology within EVs. b) Schematic representation of the HaloTag designed to covalently bind various synthetic chloroalkane‐based targeting ligands. c) Immuno‐gold labeling of EVs collected from Expi293F cells transiently transfected with a plasmid coding for CLIC1‐HaloTag and naïve EVs as control. EVs were incubated with primary CD63 and CD81 antibodies followed by secondary antibodies conjugated with 6 nm gold particles (black arrow), and primary HaloTag antibody followed by a secondary antibody with 15 nm particles (white arrow). Scale bars = 100 nm. d) Nano‐flow cytometry analysis using the CytoFLEX system of EVs isolated from naïve Expi293F or HaloTag‐Myc‐CLIC1 transfected cells. HaloTag Ligand conjugated with Oregon green dye was used for HaloTag visualization. CellTrace Far Red Cell dye was used to label the whole EV fraction. Shown is an average of 3 independent experiments ± s.e.m. e) Representative western blot analysis of EVs from CLIC1‐HaloTag or mock‐transfected cells and corresponding cell lysates. f) EVs carrying EGFP and HaloTag were incubated with the HaloTag ligand – TMR and imaged on the surface of glass bottom plates. Shown are representative co‐localization images of EGFP and TMR fluorescent signals. Scale bar = 15 µm. g) Correlation of EGFP and TMR peak intensities counts for individual EVs from (f). The dotted line illustrates the 1:1 intensity ratio. Both EFGP and TMR co‐localize in the vague of observed particles. Over 850 EVs were analyzed in each of the 3 independent experiments. h) Quantification of the number of TMR molecules per EV. The peak intensity of the point‐spread function of each detected EV was extracted and divided by the single‐molecule signal to quantify the copy number of functional HaloTag molecules in each EV. Shown is an average of 3 independent experiments ± s.e.m. i) Chemical structure of the synthetic GalNAc derivate synthesized in‐house containing a HaloTag reactive chloroalkane linker (shown in red) for HaloTag biding and display on the EV surface. j) Representative image of the primary human hepatocyte (PHH) spheroids used as a human 3D liver model for the uptake experiments. Scale bar = 200 µm. k) Evaluation of the binding efficiency of engineered EVs to PHH. EVs display GalNAc at the surface and carry NanoLuc (Nluc) protein in the lumen for luminescent tracking. Shown is the average of luciferase signals from each spheroid (n = 6) in relative luminescence units ± s.e.m. The P‐value was calculated using a two‐sided Student's T‐test. p<0.05.
