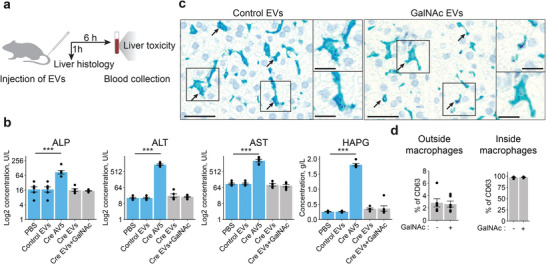
Figure 6.

Engineered EVs have a safe liver toxicity profile in vivo. a) Schematics for the experimental design. EVs (1 × 10¹¹ particles) or AV5 (1.4 × 10⁹ PFU) were injected into the tail vein of mice. Liver tissues were collected 1 h after injection for histology analysis. Blood from the saphenous vein was collected 6 h after particle tail vein injection for toxicity analyses. b) The levels of selected liver toxicity markers were compared among PBS control animals and control EVs (without Cre recombinase), adenovirus 5 with Cre recombinase protein (Cre AV5), EVs carrying Cre recombinase (Cre EVs), EVs carrying Cre recombinase and decorated with GalNAc molecules (Cre EVs+GalNAc) (n = 6). The average values indicated for each panel parameter ± s.e.m. are shown. The P‐value was calculated using a two‐sided Student's T‐test. Significant differences are indicated by asterisks (*** = p<0.001). c) Representative liver histology images of the animals treated with HaloTag engineered EVs with or without GalNAc. An anti‐human CD63 antibody assay was developed to detect injected particles in the tissue (purple dots) 1 h after the treatment. Kupffer cells were stained with F4/80 antibodies (bright blue). Arrows indicate the accumulation of CD63 signals inside cells. Scale bar = 50 µm in the wide‐field images and 25 µm in the magnifications. d) Quantification of the results described in (c). For both treatment conditions, most of the CD63‐positive cells were liver macrophages (Kupffer cells) (right panel). The average percentage ± s.e.m. of CD63‐positive cells of other types (CD63 signal is outside macrophages) is indicated on the left panel. Each data point represents different liver sections (n = 6).
