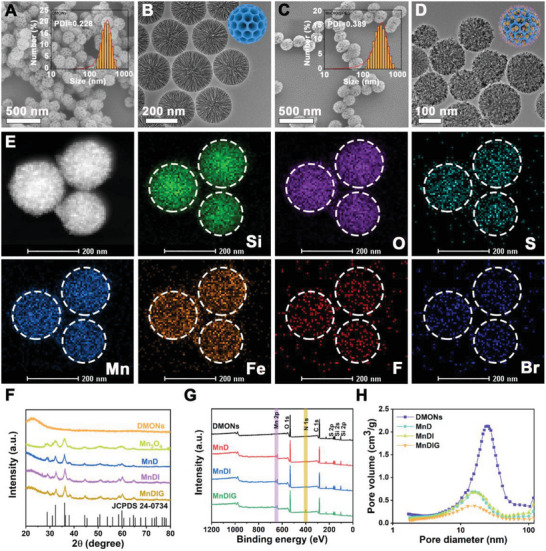
Figure 1.

SEM images of A) DMONs, and C) MnDIG@PEG (inset: hydrodynamic diameters by DLS measurement). TEM images of B) DMONs, and D) MnDIG@PEG. E) The High‐angle annular dark‐field scanning TEM (HAADF‐STEM) image of MnDIG@PEG and the corresponding elemental mappings, including Si, O, S, Mn, Fe, F, and Br. F) XRD patterns, G) full XPS spectra, and H) pore size distribution of various formulations.
