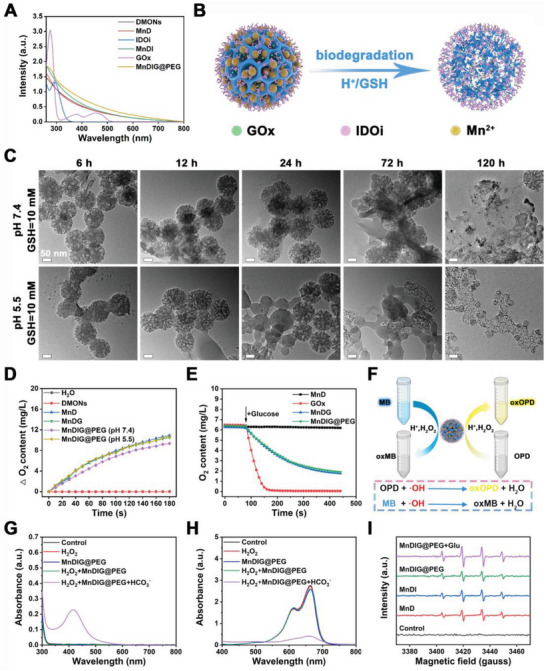
Figure 2.

A) UV–vis absorption spectra of different samples. B) Schematic illustration of pH/GSH‐triggered biodegradation process of MnDIG@PEG. C) TEM images of MnDIG@PEG after biodegradation treated under different conditions. D) O2 generation profiles of different samples. E) O2 consumption profiles of different samples in the presence of glucose. F) Schematic illustration of the catalytic procedure of MnDIG@PEG. UV–vis absorption spectra of the G) OPD and H) MB incubated with different samples. I) ESR spectra of DMPO mixed with different conditions for 30 min.
