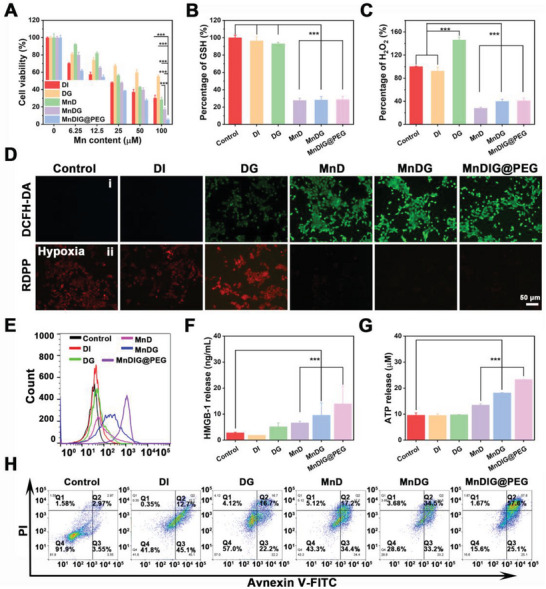
Figure 3.

A) Cell survival rates of 4T1 cells incubation for 24 h after different treatments. B) Intracellular GSH detections of 4T1 cells after 6 h of incubation with different samples. C) Intracellular H2O2 detections of 4T1 cells after 6 h of incubation with different samples. D) The detection of i) ROS or ii) O2 production in 4T1 cells by staining with DCFH‐DA or RDPP after different treatments. E) The CRT exposure in 4T1 cells after different treatments. F) The HMGB1 release in 4T1 cells after different treatments. G) The ATP release in 4T1 cells after different treatments. H) Flow cytometry apoptosis assay of 4T1 cells after different treatments for 24 h followed by staining with Annexin‐FITC and PI (n = 3, mean ± SD; * p <0.05; ** p <0.01; *** p <0.001).
