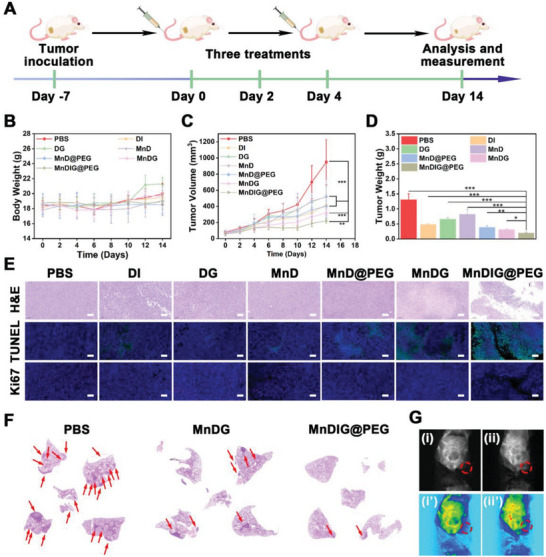
Figure 4.

A) Schematic description of the establishment of 4T1 xenograft tumor and therapeutic outcome with MnDIG@PEG. B) Body‐weight, C) tumor‐volume, and D) tumor weight of tumor‐bearing mice with different treatments. E) H&E, TUNEL, and Ki67 staining images for tumors. Scale bars: 100 µm. F) H&E staining of lungs in anti‐metastatic studies. G) In vivo T 1‐weighted MRI of i,i’) PBS and ii,ii’) MnDIG@PEG (n = 5, mean ± SD; * p <0.05; ** p < 0.01; *** p <0.001).
