Figure 2.

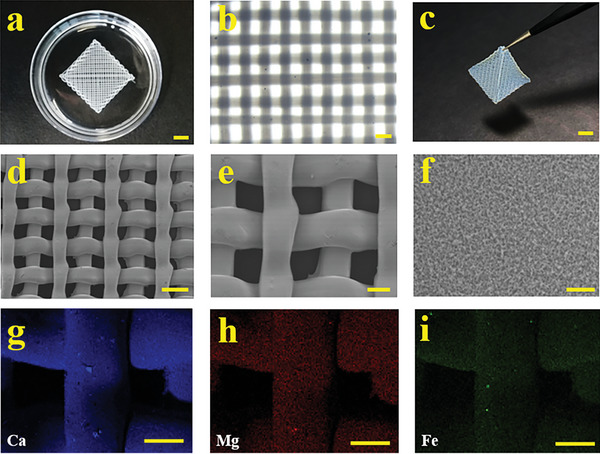
Characterization of PP scaffold. a) The digital image of the PP hybrid scaffold. b) The microscopic image of the scaffold showing its stacked architecture. c) Digital image of the free‐standing dehydrated PP hybrid scaffold. d–f) SEM images of (d) the PP Scaffold, (e) the fiber stack, and (f) the surface of the PP scaffold. g–i) Energy dispersion spectroscopy analysis showing (g) Ca, (h) Mg, and (i) Fe elements of the PP scaffold. Scale bars in (a‐c) are 5, 1, 5 mm, respectively. Scale bars in (d‐e) are 500, 200, and 10 µm, respectively. Scale bars in (g‐i) are 200 µm.
