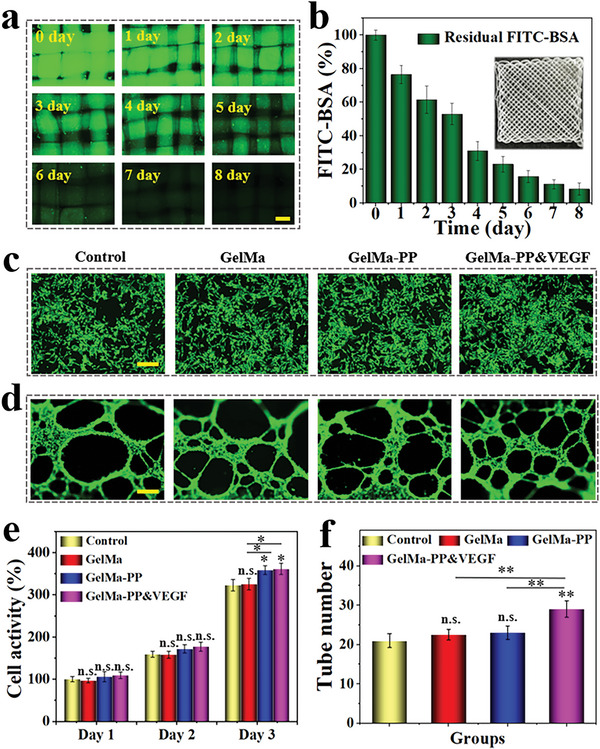
Figure 3.

Drug release, and in vitro biocompatibility and angiogenesis studies. a) Fluorescent images of FITC‐BSA laden GelMa‐PP scaffold in PBS from 0 to 8 days. b) The fluorescent intensity of the scaffold. c) Calcein‐AM staining of BMSCs after 3 days of co‐incubation with different groups. d) Tube formation of HUVECs in different groups after cultivation for 6 h. e) Statistical analysis of cell activity of BMSCs in different groups from day 1 to day 3. f) Statistical analysis of the formed tubes in different groups after 6 h of co‐culture. Scale bars are 200 µm in (a), (c), and (d). Data (n≥3) are shown as mean ± SD. n.s.: no significant, *p< 0.05, **p< 0.01, ***p< 0.001.
