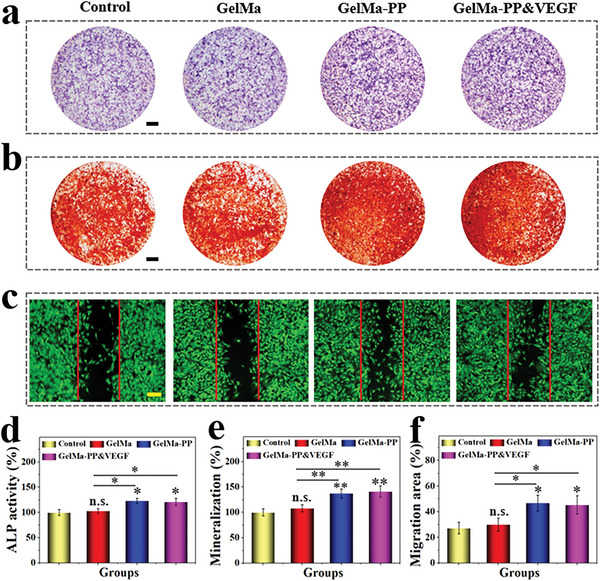
Figure 4.

In vitro osteogenesis and cell migration test. a) ALP staining of BMSCs after two weeks of induction. b) AR staining of BMSCs after two weeks of incubation. c) Fluorescent images of BMSCs in different groups after 24 h of treatment. d–f) Quantitative analysis of (d) ALP activity, e) mineralization degree, and f) cell migration area. Scale bars are 2 mm in (a) and (b), and 150 µm in (c), respectively. Data (n≥3) are shown as mean ± SD. n.s.: no significant, * p< 0.05, **p< 0.01, ***p< 0.001.
