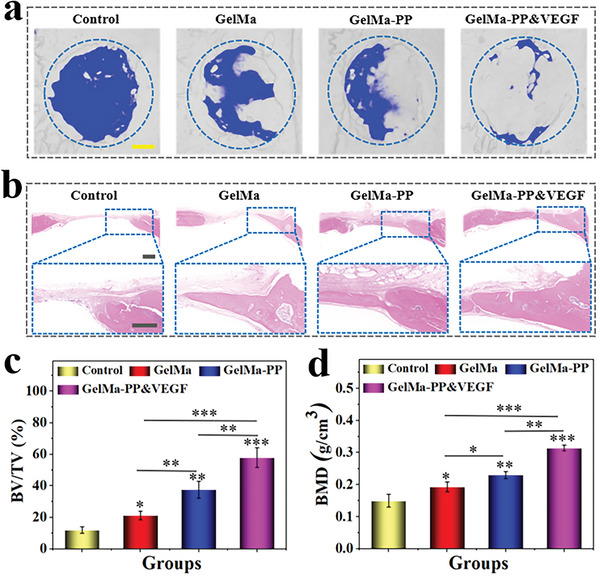
Figure 5.

In vivo bone regeneration evaluation. a) Representative 3D reconstructed micro‐CT images of the rat skulls after 8 weeks of treatment. b) Representative H&E images of defected regions in different groups after 8 weeks of treatment. c,d) Quantitative analyses of (c) BV/TV and (d) BMD of newly‐formed bone tissues at defected sites. Scale bars are 1 mm in (a) and 500 µm in (b), respectively. Data (n≥3) are shown as mean ± SD. n.s.: no significant, *p< 0.05, **p< 0.01, ***p< 0.001.
