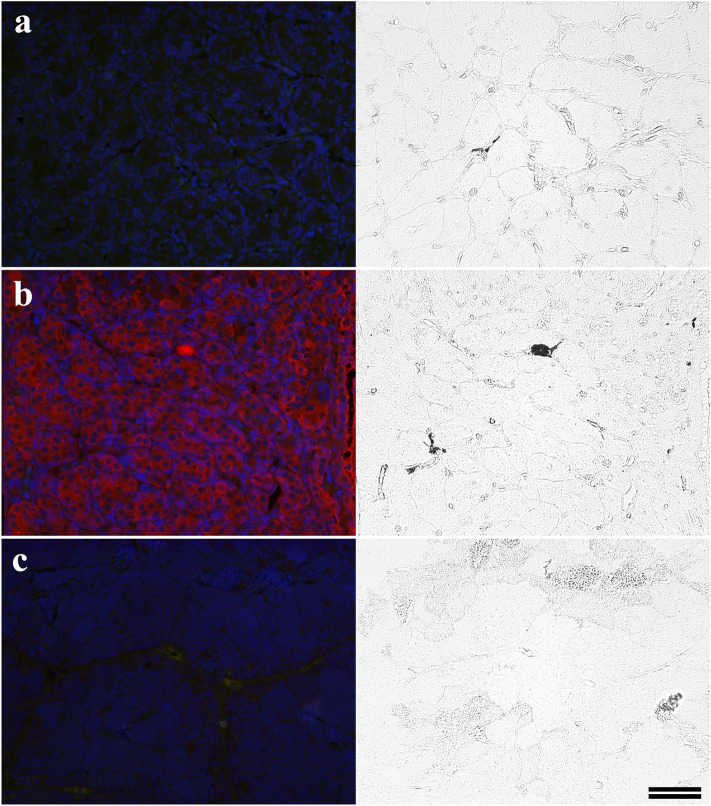
Fig. 7.
Representative fluorescent and phase-contrast images showing labeling of MBM-embedded testicular sections. The left sides of each panel a–c are the fluorescence results while the right sides are their corresponding phase contrast images. a One-year-old testicular section incubated with no primary b One-year-old testicular section incubated with GF-6 primary c Two-and-a-half-year-old testicular section incubated with GF-6 primary. The scale bar 50 μm in c applies to all panels

