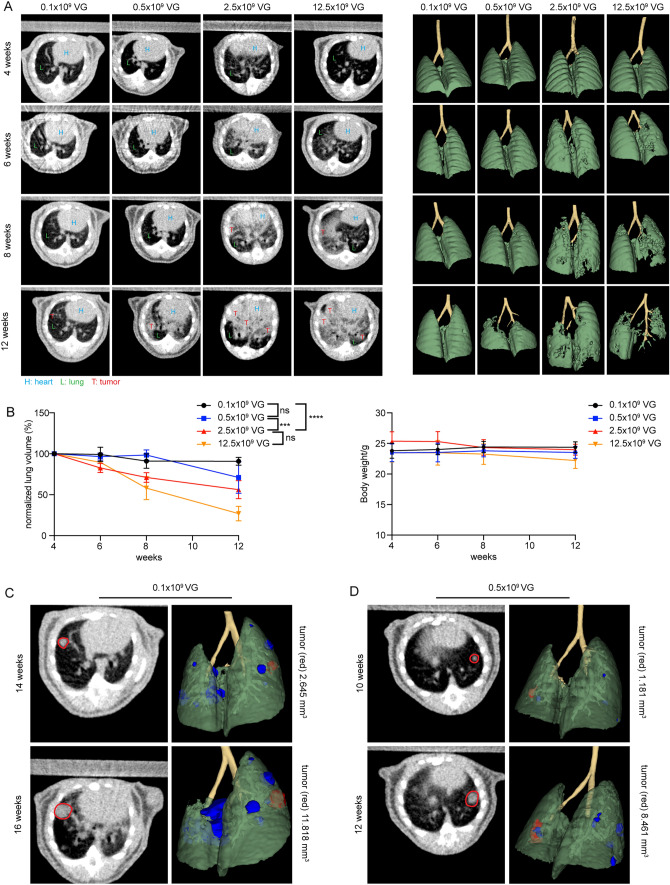
Fig. 3.
Longitudinal monitoring of tumor growth by micro-CT and 3D reconstruction. A Tumor growth was monitored longitudinally by micro-CT after inoculation with the indicated vector titers. The heart (H), lungs (L), and tumors (T) are directly identified on the images by respective labels. (left side). 3D reconstruction of functional lung volume was calculated using the 3D Slicer software (right side). B Quantification of normalized lung volume over time of animals after inoculation with the indicated vector titers. Data are presented as mean ± SEM, n = 3–4 mice. Two-way ANOVA, multiple comparisons, ns no significant difference, ***P < 0.001, ****P < 0.0001. C After inoculation with a low vector titer of 0.1 × 10⁹ VG, individual nodules were identifiable by micro-CT and could be followed over time (see red marked nodules). D Similar results were obtained after inoculation with a vector titer of 0.5 × 10⁹ VG

