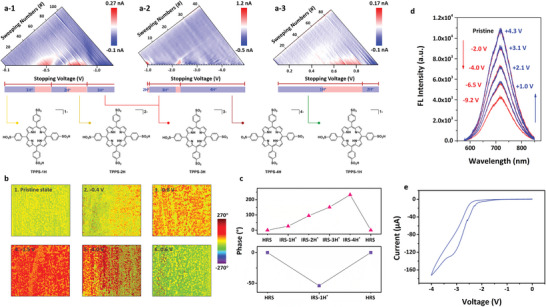
Figure 3.

a) Pseudo‐color plots of the current changes between the adjacent current–voltage curves shown in Figure 2c and Figures S13a and S14a (Supporting Information). The lower panel display sequential removal of protons from TPPS upon excitation and migration, resulting in negatively charged TPPS‐1H, TPPS‐2H, TPPS‐3H and TPPS‐4H species. b) PFM images showing polarization characteristics of the TPPS film in a 1 µm × 1 µm scanning area under negative b‐1 to b‐5) and positive b‐6) voltage biases, respectively. c) Evolution of the PFM phases in the pristine HRS and low resistance states with the migration of different numbers of protons (IRS‐1H+, IRS‐2H+, IRS‐3H+, IRS‐4H+). d) Evolution of the TPPS fluorescence intensity with the applied voltage in the lateral Au/TPPS/Au devices. e) Current–voltage hysteresis of the lateral Au/TPPS/Au device recorded during dc voltage sweeping between 0 and −4 V.
