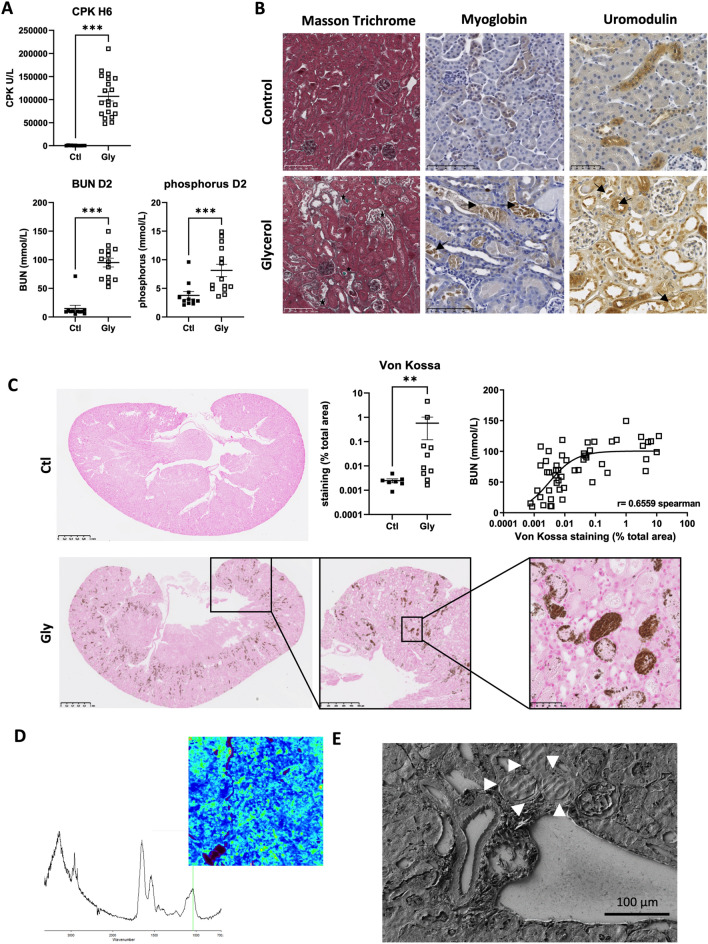
Figure 1.
Hydroxyapatite deposition within kidneys after glycerol-induced rhabdomyolysis. (A) Plasma levels of creatine phosphokinase (CPK) at 6 h (H6) and blood urea nitrogen (BUN) and phosphorus at day 2 (D2) after glycerol (Gly) or NaCl (Ctl) injection in each thigh caudal muscle. Comparisons were made with the Mann–Whitney test (n = 11–15 mice per group). (B) Representative images of Masson Trichrome, myoglobin and uromodulin staining at day 2 after glycerol (Gly) or NaCl (Control) injection (arrows show the positive staining for uromodolin and myoglobin in tubular casts, tubular cells and interstitium). (C) Representative images and quantification of calcium phosphorus deposits (Von Kossa staining). Comparisons were made with the Mann–Whitney test (n = 11–15 mice per group). Correlation between Von Kossa staining and BUN at day 2 (Spearman’ test). (D) Plug reflectance FTIR cartography and reflectance spectrum showing a peak at 1035 cm−1 specific for apatite (green bar) and a smooth and rounded peak between 1035 and 1100 cm−1 revealing the presence of amorphous calcium phosphate with a significant carbonate rate (peaks at 875 cm−1 and 1420 cm−1). (E) Scanning electron microscopy showing the presence of dense tubular plugs made of calcium phosphate (arrows). Values are expressed as mean ± SEM. *p < 0.05, **p < 0.01, ***p < 0.001, compared with the control group.

