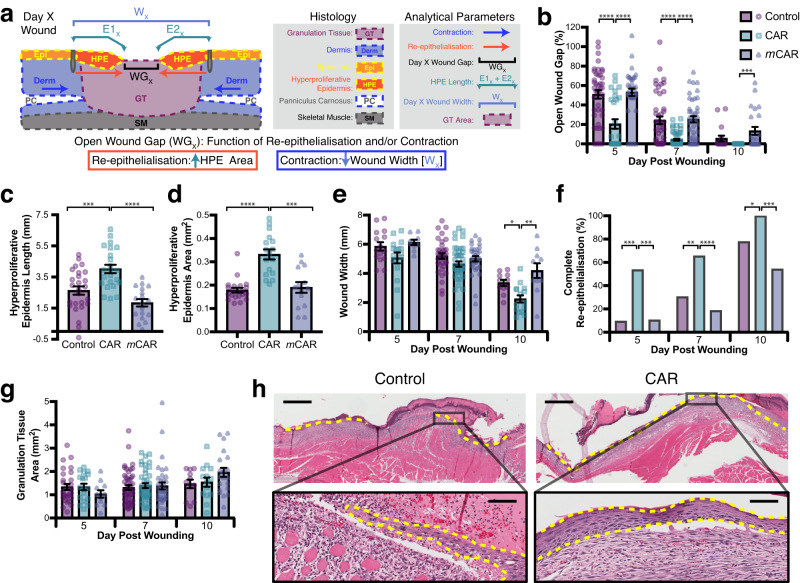
Fig. 2. CAR peptide stimulates wound re-epithelialisation.
Mice with full thickness skin excision wounds were treated with systemically administered CAR, mCAR and control (BSA/PBS) peptide as described in methods. Wounds were harvested on days 5, 7 and 10. a Schematic representation of histological analysis. Open wound gap: WGX - Gap between epithelial tongues on day X post-wounding. Re-epithelialisation: E1X + E2X - Hyperproliferative epidermis (HPE) length. Contraction: Wound width reduction WX. b Gap between the epidermal tongues (WGX: area of open wound without re-epithelialisation) represented as percentage (%) of the original wound size (Day 5: CAR vs. Control P = 6.3 × 10−05, CAR vs. mCAR P = 6.3 × 10−07; Day 7: CAR vs. Control P = 1.3 × 10−05, CAR vs. mCAR P = 1.3 × 10−07; Day 10: CAR vs. mCAR P = 0.00025). c Length of hyperproliferative epidermal tongues at day 5 (Day 5: CAR vs. Control P = 0.005, CAR vs. mCAR P = 1.1 × 10−05). d Area of hyperproliferative epidermal tongues at day 5 (CAR vs. Control P = 3.8 × 10−06, CAR vs. mCAR P = 0.00029). e Overall wound width (Wx), indicating wound contraction (Day 10: CAR vs. Control P = 0.028, CAR vs. mCAR P = 0.0023). f Percentage of completely re-epithelialised wounds (Day 5: CAR vs. Control P = 0.0002, CAR vs. mCAR P = 0.0005; Day 7: CAR vs. Control P = 0.0013, CAR vs. mCAR P = 1.0−07; Day 10: CAR vs. Control P = 0.041; CAR vs. mCAR P = 0.0002). g Cross-sectional area of granulation tissue quantified by examining two histological HE-stained sections from each wound. h Representative histological HE-stained pictures of the wounds treated with CAR peptide and control collected on day 7 illustrate wound re-epithelialisation. The epidermal tongues are marked with yellow dashed lines. Scale bars: 300 µm low magnification image, 30 µm high magnification inset. a–h Eight animals, each with four wounds, in every treatment group (N = 28, 44, 24 for days 5, 7 and 10). Source data are provided as a Source Data file. Each data point represents an individual wound. Values are mean ± S.E.M. Kruskal-Wallis rank sum test with Dunn´s test with tie correction (b, c, d, e and g) and Pearson´s Chi-square test (without continuity correction) with post-hoc test Fisher exact test (two-sided) (f).

