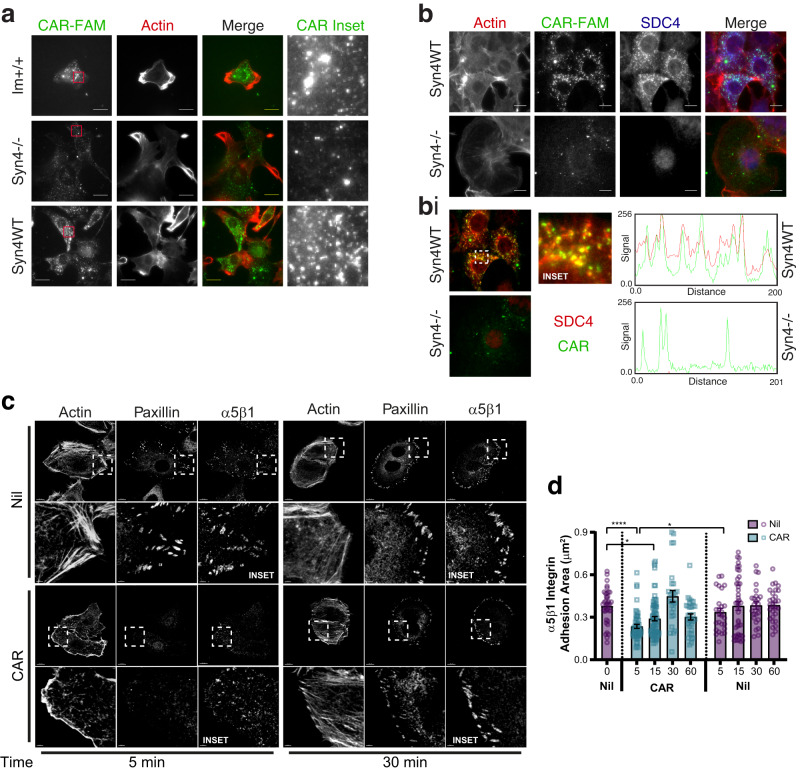
Fig. 4. CAR peptide is internalised by SDC4 and modulates α5β1 integrin adhesion complex dynamics.
a Subcellular distribution of fluorescently-labelled CAR in immortalised wild-type MEFs (Im+), syndecan-4-/- MEFs (Syn4-/-) and syndecan-4 re-expressing MEFs (Syn4WT) following 8 h treatment. CAR-FAM (Green) and actin (phalloidin-AlexaFluor-594; Red). Maximum projections of 2.1 μm z-sections are displayed. Scale bar = 20 μm. N = 2 independent replicate experiments. b Immunofluorescence demonstrating that internalised CAR co-localises with SDC4. CAR-FAM internalisation in Syn4WT and Syn4-/- MEFs. Cells were treated with CAR peptide for 8 h prior to fixation and stained for SDC4 and actin. CAR (Green), SDC4 (Blue) and actin (phalloidin-AlexaFluor-594; Red). Sum projections of 2.1 μm z-sections are displayed. Scale bar = 10 μm. N = 2 independent replicate experiments. bi Co-localisation of SDC4 and CAR in intracellular vesicles. Images correspond to Fig. 5b; sum projections of 0.6 μm z-section, positioned 0.6–1.2 μm above cell-matrix interface (central region of cells) pseudo-coloured to highlight co-localisation CAR-FAM (Green), SDC4 (Red). Dashed box highlights inset region. RGB profiles: fluorescence intensity of CAR and SDC4 along 25.8 μm segmented line intersecting CAR-FAM positive vesicles. c, d Quantitative analysis of α5β1 integrin and paxillin-positive adhesion complexes in fibronectin-bound keratinocytes following CAR peptide stimulation (N = 3 independent replicate experiments). c Subcellular distribution of α5β1 integrin, paxillin and actin in HaCaT cells on fibronectin following 5- or 30-min treatment with 10 µg/ml CAR or vehicle control. Dashed boxes indicate inset regions (depicted in lower image). Scale bars: 10 μm (main images); 2 μm (inset images). d Area of α5β1-positive integrin adhesions (μm2/cell) ± S.E.M. following 0-, 5-, 15-, 30- and 60-min treatment with 10 µg/ml CAR or vehicle control. Data points represent mean α5β1 integrin-positive adhesion area per cell. N = 3 with 26–75 images analysed per condition (Control: 0 min n = 38, 5 min n = 26, 15 min n = 43, 30 min n = 25, 60 min n = 28; CAR: 5 min n = 53, 15 min n = 75, 30 min n = 27, 60 min n = 31). Kruskal-Wallis test, followed by Dunn’s multiple comparisons test: Nil 0’ vs CAR 5’ P = 7.555 × 10⁻⁶; Nil 0’ vs CAR 15’ P = 0.0113; CAR 5’ vs Nil 5’ P = 0.0447. Source data are provided as a Source Data file.

