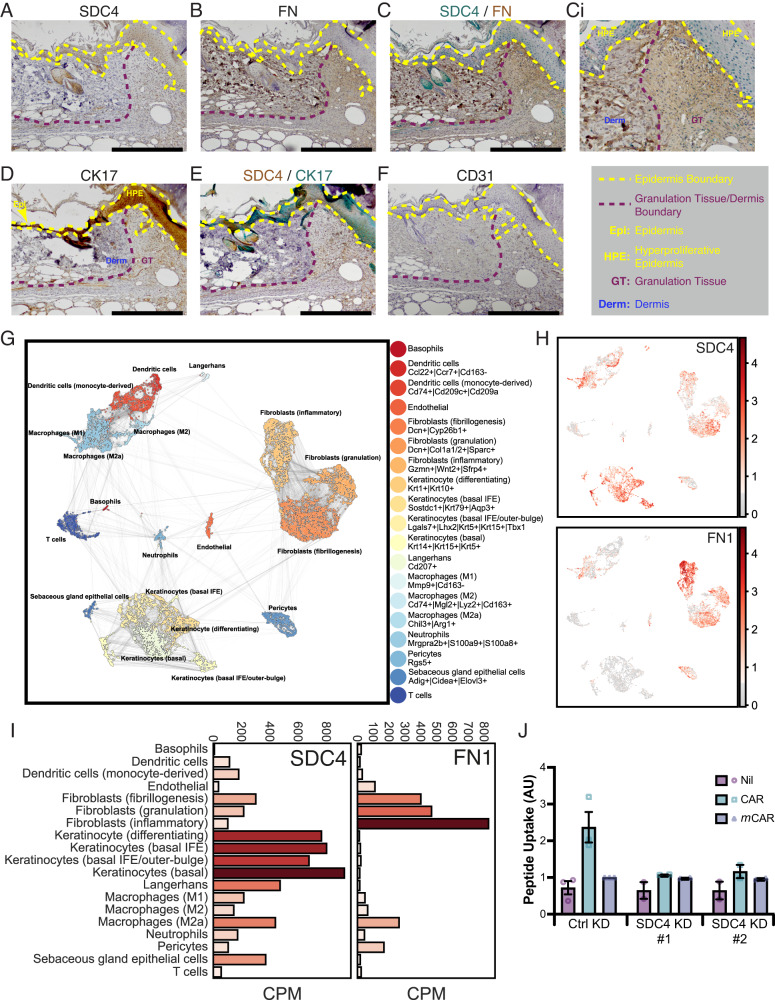
Fig. 5. SDC4 is highly expressed in wound keratinocytes and required for CAR peptide uptake.
IHC analysis of full thickness skin excision wounds. Samples were harvested from untreated mice 7 days post wounding and representative micrographs are presented of skin wound sections stained for (a) SDC4, (b) fibronectin (FN), (c) and (ci) SDC4 (Green) and fibronectin (Brown), (d) cytokeratin-17 (CK17), (e) SDC4 (Brown) and cytokeratin-17 (CK17) (green), (f) blood vessels (CD31). ci High magnification image of a region within the same field of view as (c). Epidermis is highlighted with yellow dashed lines. Boundary between granulation tissue and dermis is marked by red dashed lines. HPE: Hyperproliferative epidermis; Epi: Epidermis; GT: Granulation tissue; Derm: Dermis. SDC4 signal intensity is not directly comparable between (a) and (e). a–f n = 12 individual wounds; three animals with four wounds. Scale bar: 500 µm. g–i Single-cell RNA-Seq analysis of SDC4 and fibronectin expression in skin wounds. Single-cell transcriptomics analysis of gene expression in different cells in skin wounds23. scRNA-Seq data from 16,351 cells was analysed using the SCANPY Python library72 and clusters identified using Louvain clustering at resolution 0.75. g Clusters were visualised with the UMAP model and cell types determined by literature review of highly upregulated genes in each Louvain cluster. h Syndecan-4 (SDC4) and Fibronectin (FN1) expression mapped onto all cells. i Barplots presenting average counts per million (CPM) across each identified cell type are given for both genes. j Uptake of fluorescent-labelled peptides by HaCaT cells transfected with control siRNA (CTRL KD), human SDC4-targeting siRNA oligo #1 (SDC4 KD #1) or human SDC4-targeting siRNA oligo #2 (SDC4 KD #2), treated with CAR-FAM, mCAR-FAM or vehicle control (Nil) for 4 h. Data are from 2 to 3 independent replicate experiments (CTRL KD: N = 3; SDC4 KD #1 & #2: N = 2) and normalised relative to the mCAR-FAM signal in CTRL KD cells. Each data point represents mean uptake in each independent experiment ± S.D. Source data are provided as a Source Data file.

