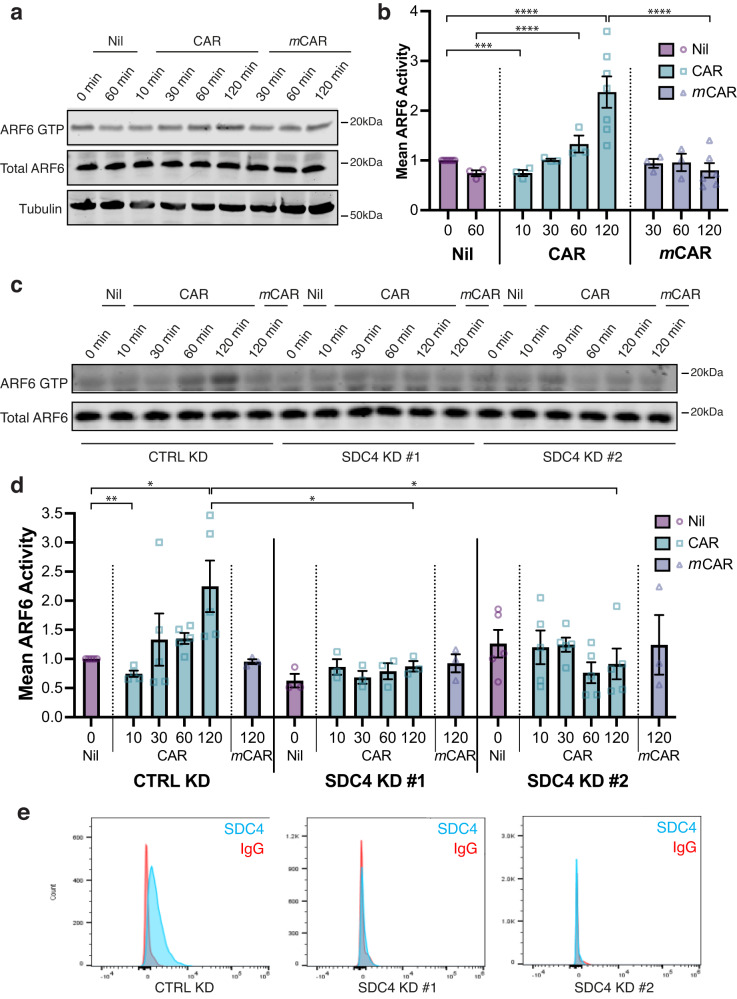
Fig. 6. SDC4 regulates CAR peptide-mediated ARF6 activity.
a, b ARF6 activity (ARF6 GTP) assessed by effector pull-down in HaCaT keratinocytes in the presence or absence of 10 µg/ml CAR or mCAR peptide. a Representative blots of ARF6 activity during time-course. ARF6 GTP: ARF6 detection in GST-GGA3 pull-down eluate. Total ARF6: ARF6 expression in total cell lysate. Tubulin: total cell lysate loading control. b Mean ARF6 activity, relative to total ARF6 ± S.E.M. normalised to 0 min Nil treatment. N = 3–7 independent biological replicate experiments (Nil: 0 min N = 7, 60 min N = 3; CAR: 10–60 min N = 3, 120 min N = 7; mCAR: 30–60 min N = 3, 120 min N = 6). Datapoints represent ARF6 activity per experiment. Two-way ANOVA with Tukey’s multiple comparisons test: Nil 0’ vs CAR 120’ P = 6.457 × 10⁻⁵; CAR 120’ vs mCAR 120’ P = 6.732 × 10⁻⁶; Nil 60’ vs CAR 60’ P = 4.865 × 10⁻⁵; CAR 60’ vs mCAR 60’ P = 0.0063. Holm-Sidak t test: Nil 0’ vs CAR 10’ P = 0.0004. c–e ARF6 activity in HaCaT cells transfected with control siRNA (CTRL KD), human SDC4-targeting siRNA oligo #1 (SDC4 KD #1) or human SDC4-targeting siRNA oligo #2 (SDC4 KD #2), in the presence or absence of 10 µg/ml CAR or mCAR peptide. c Representative blots of ARF6 activity during time-course. ARF6 GTP: ARF6 detection in GST-GGA3 pull-down eluate; total ARF6: ARF6 expression in total cell lysate. d Mean ARF6 activity, relative to total ARF6 ± S.E.M. normalised to Nil treatment. N = 3–5 independent replicate experiments (Ctrl KD: Nil 0 min N = 5; CAR 10 min N = 4, 30–120 min N = 5; mCAR 120 min N = 3. SDC4 KD #1: Nil 0 min N = 3; CAR 10–120 min N = 3; mCAR 120 min N = 3. SDC4 KD #5: Nil 0 min N = 5; CAR 10–120 min N = 5; mCAR 120 min N = 3). Datapoints represent ARF6 activity per experiment. Two-way ANOVA with Tukey’s multiple comparisons test: CTRL KD Nil 0’ vs CAR 120’ P = 0.0299; CTRL KD CAR 120’ vs SDC4 KD #1 CAR 120’ P = 0.0499; CTRL KD CAR 120’ vs SDC4 KD #2 CAR 120’ P = 0.0132. Holm-Sidak t test: CTRL KD Nil 0’ vs CTRL KD CAR 10’ P = 0.0012. Source data are provided in Source Data file. e Flow cytometric analysis of cell surface SDC4 in HaCaTs following SDC4 knockdown.

