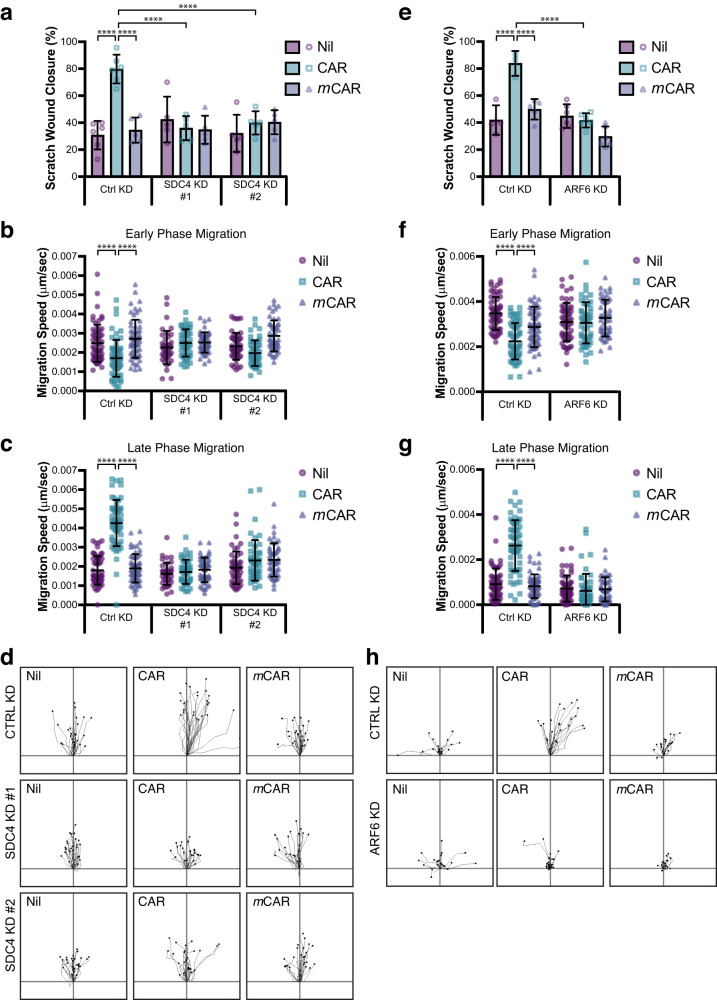
Fig. 7. CAR promotes SDC4- and ARF6-dependent keratinocyte migration.
Migration of HaCaT keratinocytes on fibronectin in scratch wound assays, in the presence or absence of 10 µg/ml CAR or mCAR peptide. Cells were analysed over 17 h (a–d) or 20 h (e–h) by time-lapse microscopy. a–d HaCaT cells transfected with control siRNA (CTRL KD), human SDC4-targeting siRNA oligo #1 (SDC4 KD #1) or human SDC4-targeting siRNA oligo #2 (SDC4 KD #2). a Scratch wound closure, (b) speed at early phase of migration (Timepoint 0–5 h), (c) speed at late phase of migration (Late: Timepoint 12–17 h), and (d) representative migration tracks during late phase migration. See also Supplementary Movie S3 and S4 and Supplementary Fig. S7a, b. Data are representative from one of four independent experiments. Values are means ± S.E.M. All statistical analyses are two-way ANOVA with Tukey’s multiple comparisons test. a n = 5–6 fields of view per condition (Ctrl KD: Nil & CAR n = 6; mCAR n = 5. SDC4 KD #1 & #2: Nil, CAR & mCAR n = 5); CTRL KD Nil vs CAR P = 1.383 × 10⁻⁷; CTRL KD CAR vs mCAR P = 2.239 × 10⁻⁶; CTRL KD CAR vs SDC4 KD #1 CAR P = 4.341 × 10⁻⁶; CTRL KD CAR vs SDC4 KD #2 CAR P = 2.630 × 10⁻⁵. b, c n = 40–60 cells per condition. b Early phase: CTRL KD Nil vs CAR P = 9.808 × 10⁻⁶; CTRL KD CAR vs mCAR P = 1.639 × 10⁻⁹. (c) Late phase: CTRL KD Nil vs CAR P = 2.520 × 10⁻¹¹; CTRL KD CAR vs mCAR P = 2.520 × 10⁻¹¹. e–h HaCaT cells transfected with control siRNA (CTRL KD) or human ARF6-targeting siRNA. e Scratch wound closure, (f) speed at early phase of migration (Timepoint 0–5 h), (g) speed at late phase of migration (Late: Timepoint 15–20 h), and (e) representative migration tracks during late phase migration. See also Supplementary Movie S5 and S6 and Supplementary Fig. S7c, d. Data are representative from one of four independent experiments. Values are means ± S.D. All statistical analyses are two-way ANOVA with Tukey’s multiple comparisons test. e n = 4–6 fields of view per condition (Ctrl KD: Nil n = 4, CAR n = 3; mCAR n = 5. ARF6 KD: Nil, CAR & mCAR n = 6); CTRL KD Nil vs CAR P = 6.312 × 10⁻⁶; CTRL KD CAR vs mCAR P = 7.806 × 10⁻⁵; CTRL KD CAR vs ARF6 KD CAR P = 1.636 × 10⁻⁶. f, g n = 49–60 cells per condition (Ctrl KD: Nil & CAR n = 60, mCAR n = 59. ARF6 KD: Nil n = 58, CAR & mCAR n = 49). f Early phase: CTRL KD Nil vs CAR P = 6.82 × 10⁻¹³; CTRL KD CAR vs mCAR P = 0.0006; CTRL KD CAR vs ARF6 KD CAR P = 8.897 × 10⁻⁶ (g) Late phase: CTRL KD Nil vs CAR P = 4.68 × 10⁻¹³; CTRL KD CAR vs mCAR P = 4.68 × 10⁻¹³; CTRL KD CAR vs ARF6 KD CAR P = 4.68 × 10⁻¹³ (a, e) Each data point represents a single field of view; (b, c, e, f) Each data point represents an individual cell. Source data are provided as a Source Data file.

