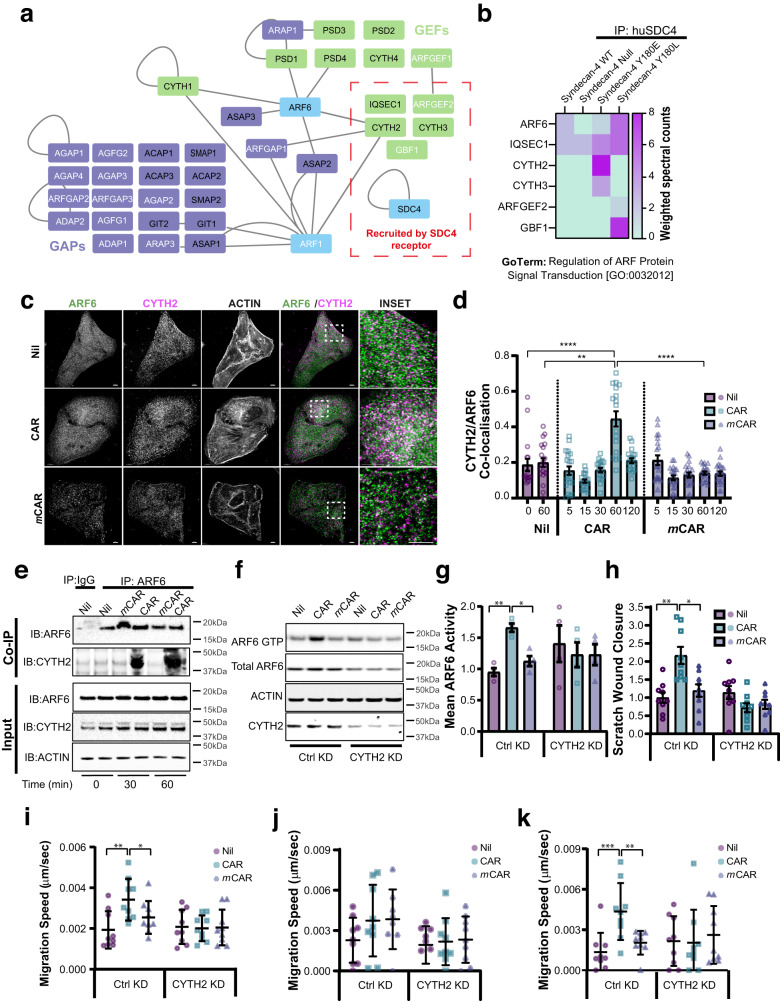
Fig. 8. CYTH2 regulates CAR peptide-mediated ARF6 activity.
a, b Proteomic analysis of ARF regulatory molecules co-immunoprecipitating with human SDC4 (huSDC4) from Syn4WT, Syn4-/-, Syn4Y180E and Syn4Y180L MEFs. a Protein-protein interaction network of molecules in the GO Term “Regulation of ARF Protein Signal Transduction” [GO:0032012]. GEFs: green nodes; GAPs: purple nodes; Blue nodes: proteins not in GO:0032012 (ARF6, ARF1 GTPases and SDC4 bait protein); Edges (grey lines): known protein-protein interactions; Black labels: proteins with reported ARF6 activity modulation properties27; white labels: proteins not reported to modulate ARF6 activity27. Red dashed box: proteins co-immunoprecipitating with huSDC4. b Heatmap displaying proteins within GO:0032012 co-immunoprecipitating with huSDC4. Colour-coding indicates enrichment levels (weighted spectral counts). c, d Quantitative analysis of CYTH2/ARF6 co-localisation following CAR peptide stimulation. c Subcellular distribution of CYTH2 (magenta) and ARF6 (green) following 60-min treatment 10 µg/ml CAR, mCAR or vehicle control. Dashed boxes: inset regions. Scale bars: 5 μm (main images); 2 μm (insets). d Pearson’s coefficient of CYTH2 and ARF6 co-localisation ± S.E.M. following 0–120-min treatment with 10 µg/ml CAR or vehicle control. Datapoints represent mean Pearson’s coefficient of CYTH2 and ARF6 co-localisation per image. N = 3 independent replicate experiments with 17–22 images analysed per condition. Kruskal-Wallis test with Dunn’s multiple comparisons test: Nil 0’ vs CAR 60’ P = 7.385 × 10⁻⁵; Nil 60’ vs CAR 60’ P = 0.0019; CAR 60’ vs mCAR 60’ P = 3.828 × 10⁻⁶. e CAR peptide promotes association of CYTH2 with ARF6. Immunoprecipitation of ARF6 following 0, 30 or 60 min CAR or mCAR treatment. immunoprecipitation with rabbit anti-ARF6 (IP: ARF6); or non-immune rabbit IgG (IP: IgG). Immune complex-associated CYTH2 and ARF6 detected by western blot. f, g ARF6 activity in CTRL KD or CYTH2 KD keratinocytes following 120 min in presence or absence of CAR or mCAR. N = 4 Independent biological replicate experiments. f Representative blots of ARF6 GTP (GST-GGA3 pull-down eluate); Total ARF6: ARF6 expression in total cell lysate. Actin detection in TCL acts as a loading control. CYTH2 detection in TCL demonstrates level of siRNA-mediated knockdown. g Mean ARF6 activity relative to total ARF6 ± S.E.M. normalised to Nil treatment in Ctrl KD cells. N = 4 independent replicate experiments. Datapoints represent ARF6 activity in each experiment. Brown–Forsythe and Welch ANOVA test for multiple comparisons assuming non-equal variance: CTRL KD Nil vs CAR P = 0.0027; CTRL KD CAR vs mCAR P = 0.0213. h–k Migration of control (CTRL KD) or human CYTH2 knockdown (CYTH2 KD) HaCaTs in presence or absence 10 µg/ml CAR or mCAR peptide. h Scratch wound closure relative to untreated Ctrl KD cells, (i) mean migration speed throughout timelapse, j speed at early migration phase (0–5 h), k speed at late migration phase (12–17 h). Migration data are means ± S.E.M from three independent experiments in triplicate. Statistical analyses are two-way ANOVA with Tukey’s multiple comparisons test: h Scratch wound closure: CTRL KD Nil vs CAR P = 3.331 × 10⁻⁵; CTRL KD CAR vs mCAR P = 0.0005; i Total migration speed: CTRL KD Nil vs CAR P = 0.017; CTRL KD CAR vs mCAR ns; k Late phase: CTRL KD Nil vs CAR P = 0.0039; CTRL KD CAR vs mCAR P = 0.0317. Source data are provided as a Source Data file.

