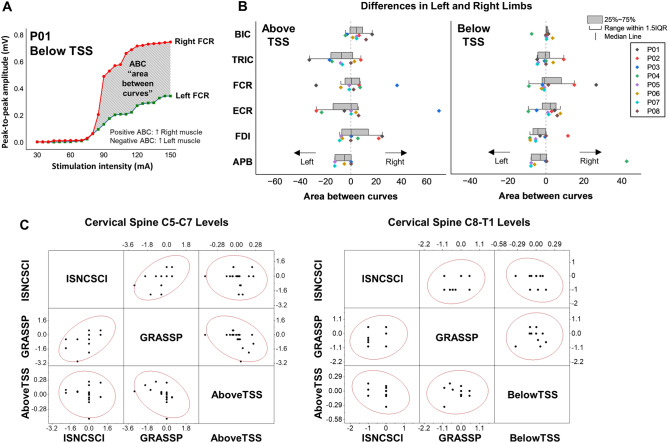
Figure 7.
Relationship in bilateral limb asymmetric between clinical/functional scores and spinally evoked motor potential. (A) Sample analysis of area between curves (ABC) between the right and left muscles for P01 during stimulation below the lesion. (B) ABC of individual data in upper-limb muscles during stimulation above and below the lesion. The dots shifted to the left (negative values) indicate that the left muscle had a greater amplitude than the right muscle, whereas the dots shifted to the right (positive values) indicate that the right muscle had a greater amplitude than the left muscle. (C) Scatter matrix plot with Pearson’s correlation coefficient in left and right limb asymmetry between ISNCSCI ULMS and GRASSP strength scores and motor evoked potentials in UL motor pools during TSS above the lesion (left) and below the lesion (right). TSS transcutaneous spinal stimulation, BIC biceps brachii, TRIC triceps brachii, FCR flexor carpi radialis, ECR extensor carpi radialis, FDI first dorsal interosseous, APB abductor pollicis brevis muscles.

