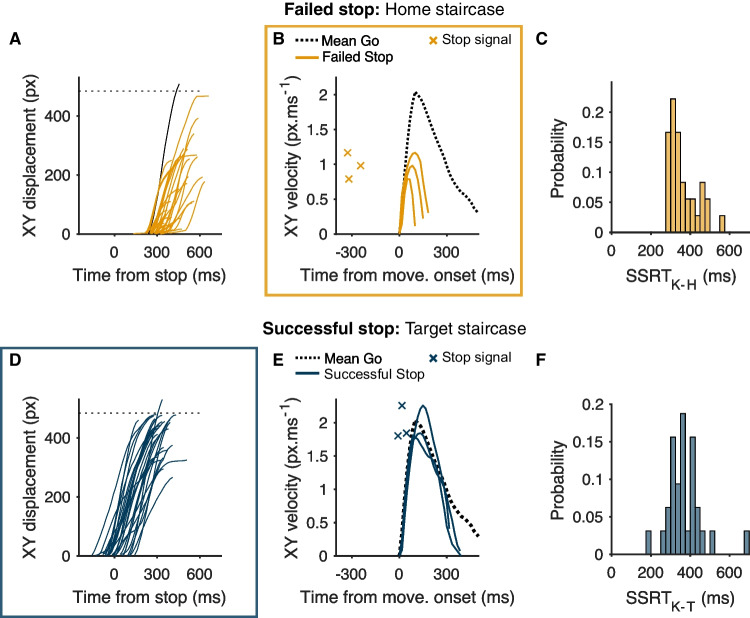
Fig. 2.
Exemplar data from a single subject. a, d Resultant displacement of the cursor (in pixels), with each trace representing a single trial. Dashed horizontal line reflects a pseudo-threshold for a movement being registered as entering the target and is shown for illustrative purposes only, since in reality the target was square and could be entered at various points. Although trials in the home staircase are labeled failed stops, movements were generally still cancelled before the target was reached. The black trace here represents a trial where the individual failed to stop before reaching the target. This trial is considered a trigger failure (TFK-H). In d, one trace appears to exceed the pseudo-threshold for a response but, in reality, the cursor did not enter the target. b, e The resultant velocity of the cursor for select stopping trials, as well as the average across all go trials. Velocity profiles in failed stop trials (b) have a smaller peak and decline much more rapidly compared to go trials. We took the time of the peak relative to the time of the stop signal as a single-trial measure of stopping latency. In e, the stop signals arrive much closer to movement onset and so the velocity profiles of successful stops are very similar to those of go trials for much of their time course, diverging only later when the movement is already decelerating. The time of the peak velocity is less informative about the stop process here, and so we simply used the time at which the cursor reached its maximum displacement (d) as the completion of the stop process and took this time relative to the stop signal as the latency of stopping. c, e The distribution of stopping latencies across trials (SSRTK) measured using the velocity and displacement methods

