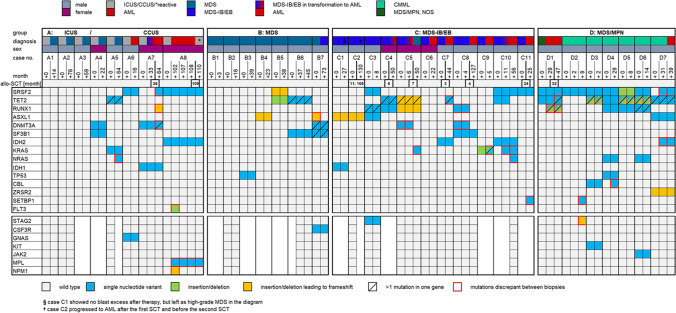
Fig. 2.
Mutational profiles according to diagnostic group. The chart shows the mutational profile for each group. For each case, the consecutive biopsies are next to each other from left to right, illustrating the evolution of diagnosis and mutational spectrum. Only genes mutated in at least one sample are shown; the genes with only wild-type results (BRAF, CALR, CEBPA, ETNK1, HRAS, IKZF1, STAT3, and U2AF1) are not depicted. Four of five biopsies from patient A8 and one biopsy from patient C10 were additionally analyzed by the commercially available Oncomine Myeloid Research Panel (Thermo Fisher Scientific, Waltham, MA, USA) during routine processing

