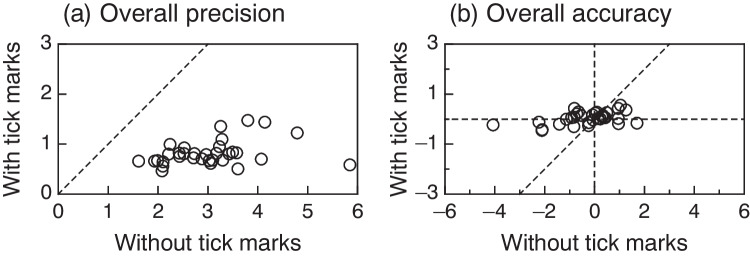
Fig. 5.
Scatter plot of overall precision (a) and overall accuracy (b) with and without tick marks. Each symbol represents a different subject. Note that the vertical axis is half the size of the horizontal axis in each panel in order to accommodate differences in ranges without distorting the scales across axes. The 45-deg identity line in each panel and the cross lines at the origin in the right panel are plotted for reference. Symbol position along the horizontal dimension represents the overall measure of average absolute error (AAEiU) in the left panel and the overall measure of distance to target (DiU) in the right panel for settings made without tick marks. Symbol position along the vertical dimension represents analogous indices of accuracy and precision (AAEiM and DiM) for settings made with tick marks

