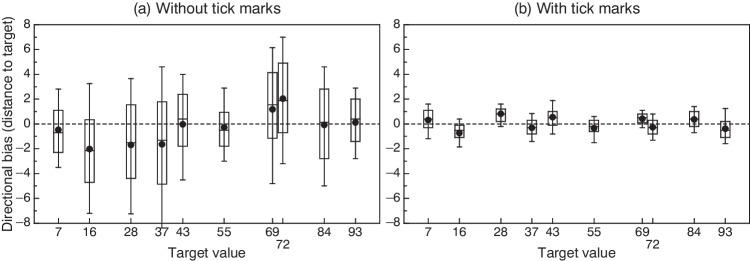
Fig. 7.
Box plots for overall distributions of settings at each target location with the unmarked VAS line (a) or the marked VAS line (b), expressed as distance to the corresponding target. Each box plot summarizes a maximum of 330 settings (33 subjects × 10 repetitions) and a minimum of 324 settings in cases in which outlying settings had been removed. Negative values along the vertical axis represent leftward bias; positive values represent rightward bias. The bottom and top edges of each box indicate the 25th and 75th percentiles, the central horizontal line indicates the median, and the whiskers extend from the 10th to the 90th percentiles. A circle indicates the mean

