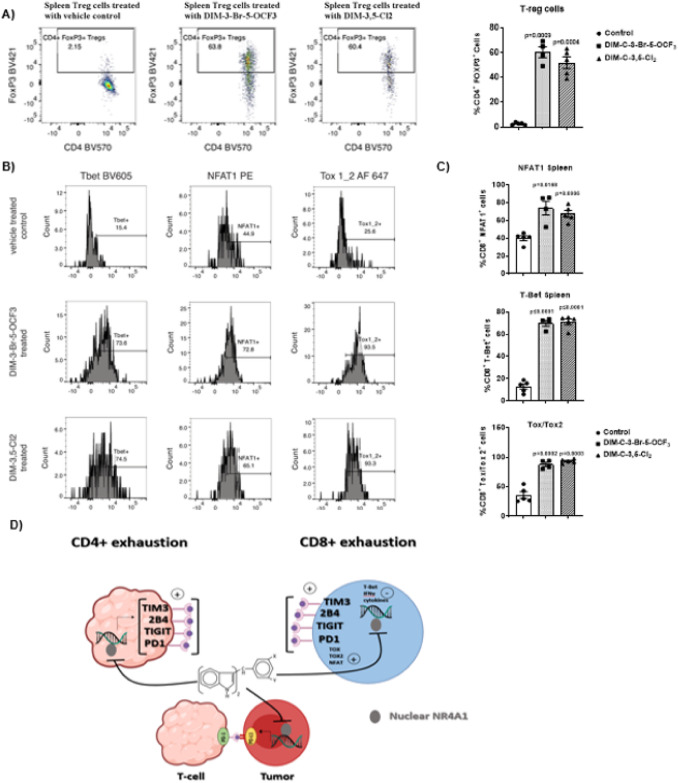
Fig. 7.
Flow cytometric analysis of cell surface markers associated with CD8+ T-cell exhaustion in spleen. Splenic lymphocytes were isolated from mice treated with corn oil (control), DIM-3-Br-5-OCF3 (2.5 mg/kg/d) and DIM-3,5-Cl2 (2.5 mg/kg/d) and flow cytometric analysis using specific antibodies was used to determine the percentage of regulatory Tcells (Tregs) (A) and CD8+ T-cells expressing transcription factors Tbet, NFAT1, and Tox1/2 (B, C). The results are expressed as means ± SD. n = 5 for control and DIM-3,5-Cl2 groups, n = 4 mice in DIM-3-Br-5-OCF3 group. Significant (p values) induction or inhibition is indicated in graphs. D Graphical summary of the effects of NR4A1 antagonists in tumors, spleen and lymphocytes (tumors and spleen)

