
Fig. 5. Signal deconvolution of the 13C NMR signal at 9.4 T (100.6 MHz resonance frequency).
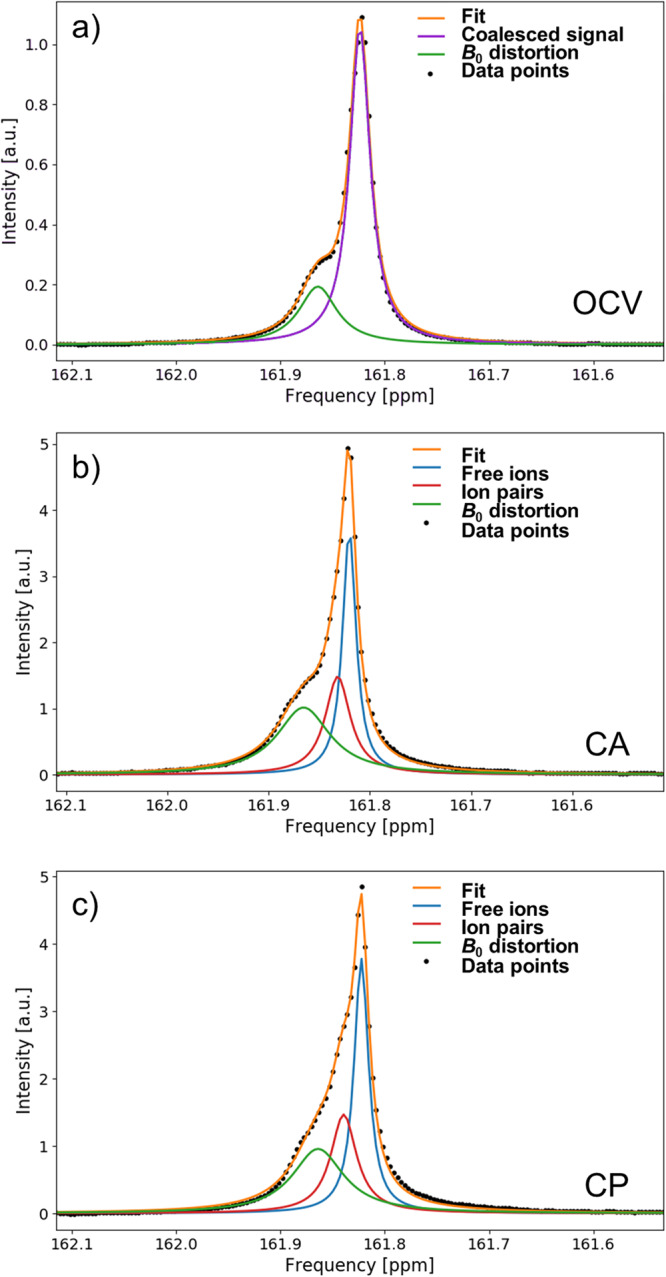
The evolves from the open circuit voltage (OCV) stage a over the chronoamperometry (CA) stage b to the chronopotentiometry (CP) stage c in a similar fashion to Fig. 4, where the free ion are depicted in blue, ion pairs in red, and coalesced signal in purple. An additional signal component (green) represents the B0 distortion in proximity to the working electrode. Due to the weaker B0 field strength, the separation of the free ion and ion pair signal is not as pronounced.