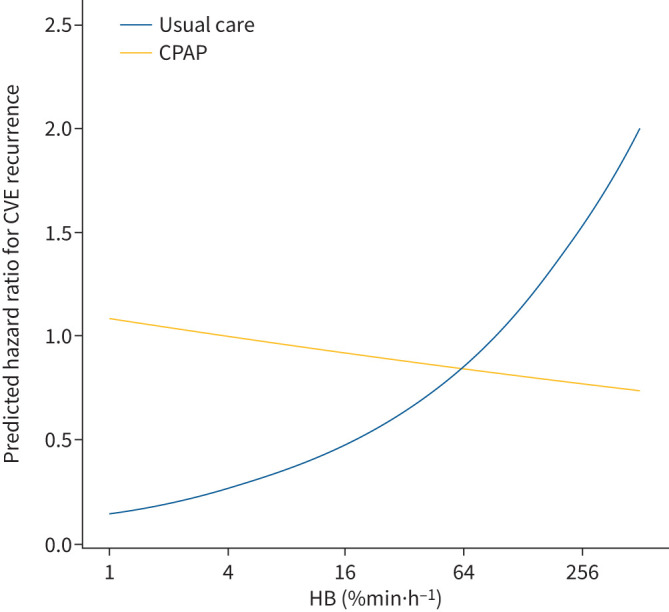
FIGURE 4.

Dose–response relationship between baseline hypoxic burden (HB) and predicted risk for cardiovascular events (CVEs) stratified by treatment arm. The curves illustrate the predicted hazard for the primary end-point in the continuous positive airway pressure (CPAP) and the usual care groups, according to the continuous HB level. The predicted hazard ratios were estimated using the average baseline characteristics: average age (59.7 years), male sex (majority), average body mass index (29.3 kg·m−2) and absence of previous cardiovascular disease (majority). The x-axis is log-scaled.
