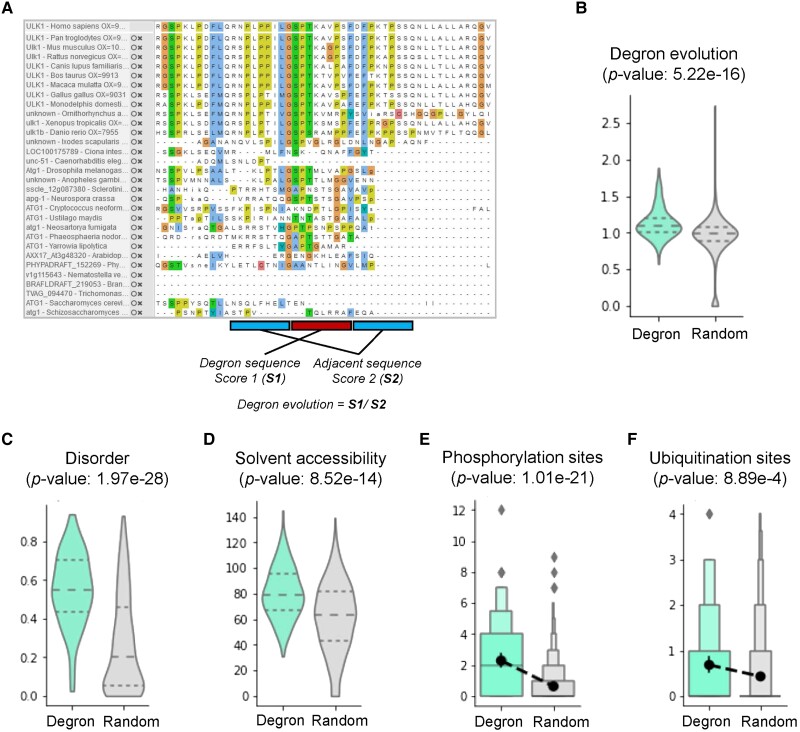
Fig. 2.
Evolutionary and structural analysis of annotated degron instances and equally long randomly chosen sequences from the human proteome. The P-values were derived from 2-tailed Mann–Whitney tests. a) The diagram of degron evolutionary analysis. b) Distribution of the evolutionary scores of annotated degron instances randomly chosen sequences. c, d) Distribution of the disordered c) and solvent-accessible d) scores of annotated degron instances randomly chosen sequences. e, f) The number of phosphorylation e) and ubiquitin conjugation sites (ubiquitination, f) for annotated degron instances and randomly chosen sequences.

