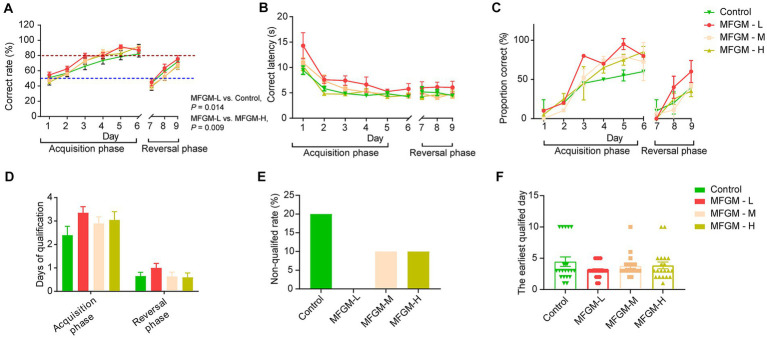
Figure 2.
T-maze performance of piglets aged 16–24 days. Correct rate (A); Correct latency (B); Proportion correct rate (C); Days of qualification (D); Non-qualified rate (E); The earliest qualified days (F). n = 20 in Control and MFGM-H groups; n = 19 in MFGM-L and MFGM-M groups. Data were presented as mean ± SEM.

