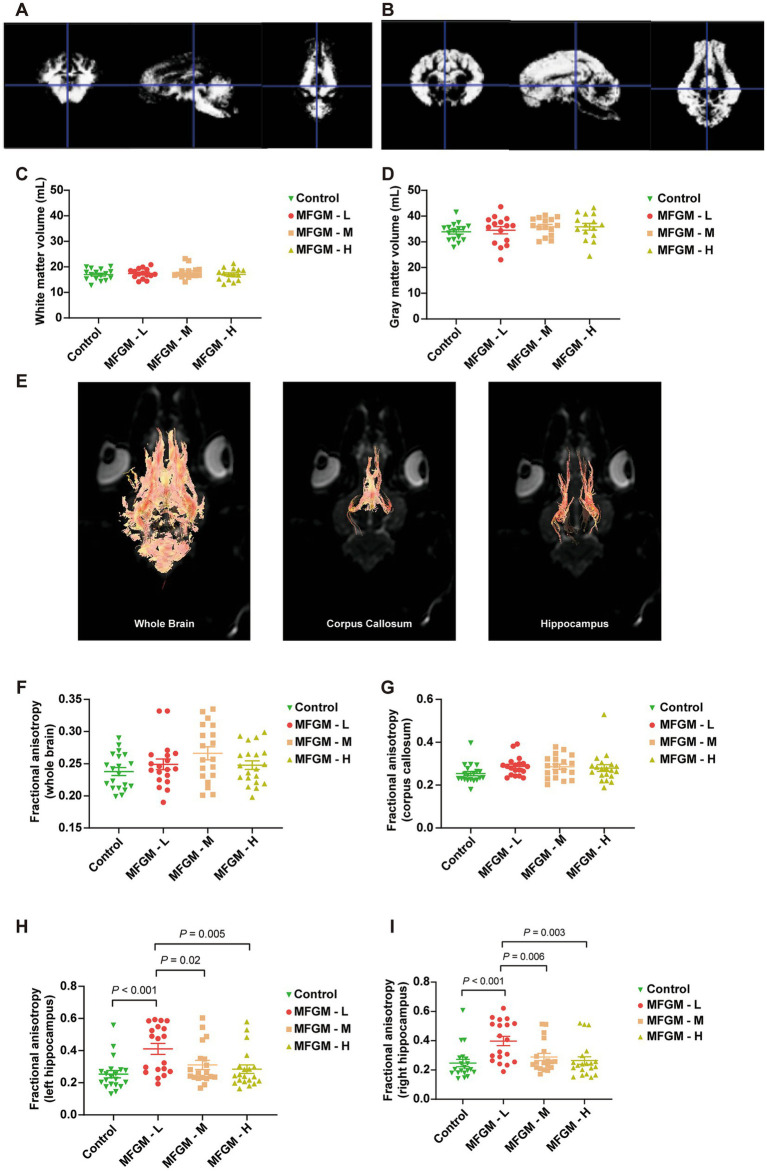
Figure 3.
The volume and fractional anisotropy of white matter and gray matter determined by MRI. Representative images of white matter (A) and gray matter (B) determined by VBM. The volume of White matter (C), Gray matter volume (D), Representative image of Fractional anisotropy in of the whole brain, corpus callosum, and hippocampus (E). Fractional anisotropy analysis of the whole brain (F), corpus callosum (G), left hippocampus (H), and right hippocampus (I). n = 20 in Control and MFGM-H groups; n = 19 in MFGM-L and MFGM-M groups. Data were presented as mean ± SEM.

