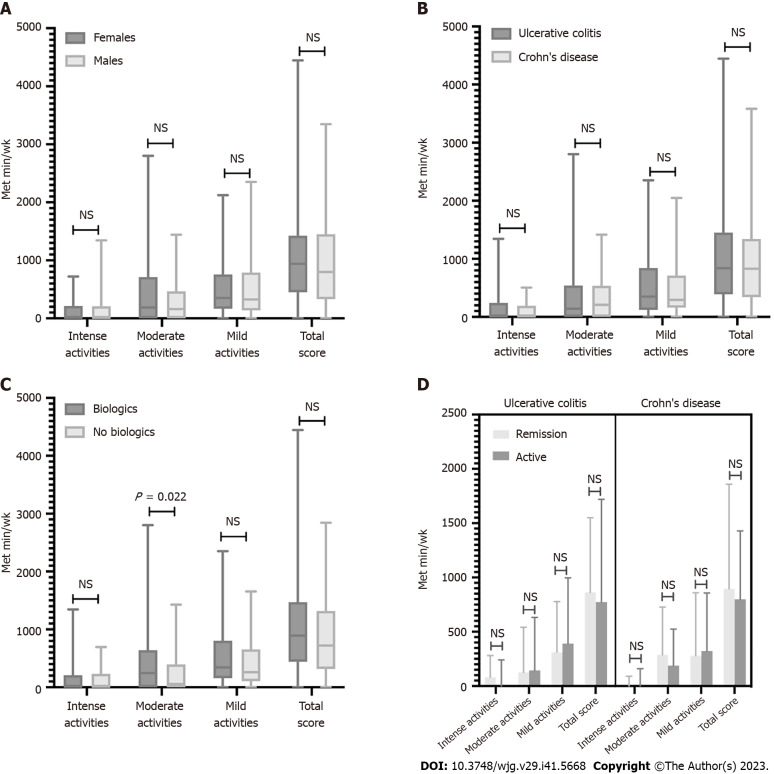
Figure 2.
Physical activity levels in the main subgroups examined. A-D: Physical activity levels observed in males and females (A), patients with ulcerative colitis and Crohn's disease (B), patients on treatment and not on biologics (C), and, finally, patients physically active or inactive concerning baseline disease activity (D). Met: Metabolic rate; NS: Not significant.

