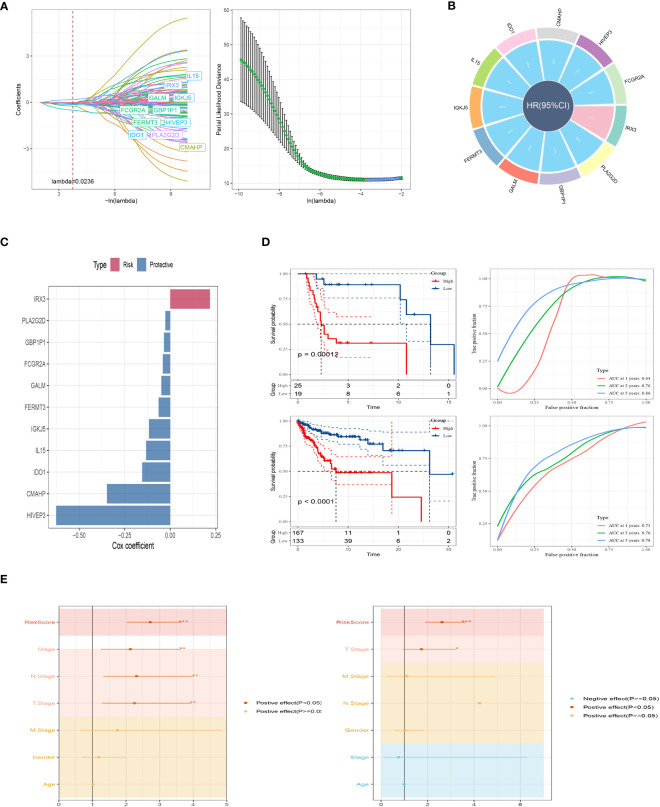
Figure 4.
A brand-new risk signature built using several SRGs. (A) Each independent variable’s trajectory and distribution for the lambda. (B) Circle plot showing each gene in the risk signature. (C) The multivariate Cox coefficients for each gene in the risk signature. (D) K-M and ROC curves of the risk signature in GSE19234 and TCGA cohort. (E) Results of univariate and multivariate Cox regression analysis based on risk score and clinicopathologic features.

