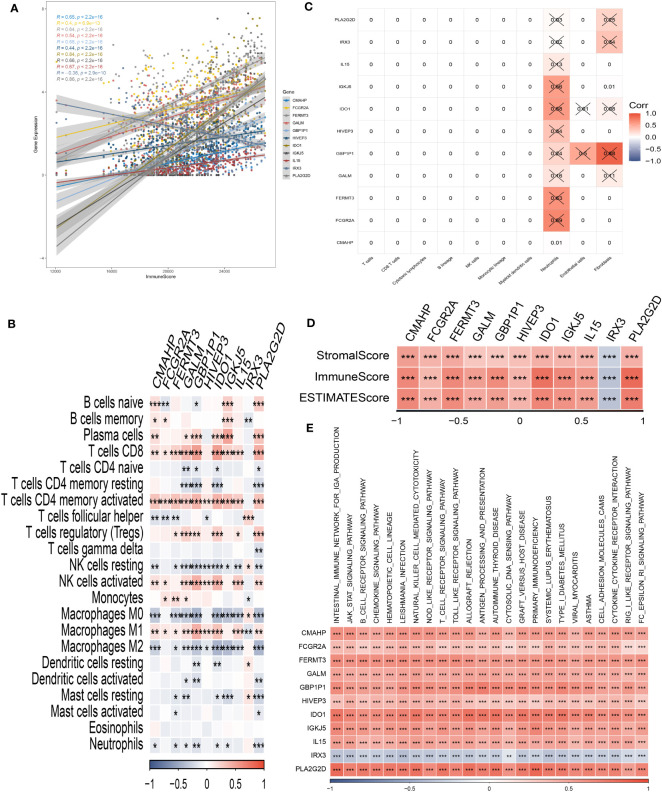
Figure 6.
Analysis of immunological infiltrations. (A) The correlation analysis between risk genes and immunity. (B, C) Correlations between eleven hub genes and 22 immune-related cells. (D) Correlations between the eleven genes and immune score, stromal score, and estimate score. (E) The correlation analysis between eleven hub genes and signaling pathway. *P < 0.05, **P < 0.01, ***P < 0.001.

