FIGURE 1.
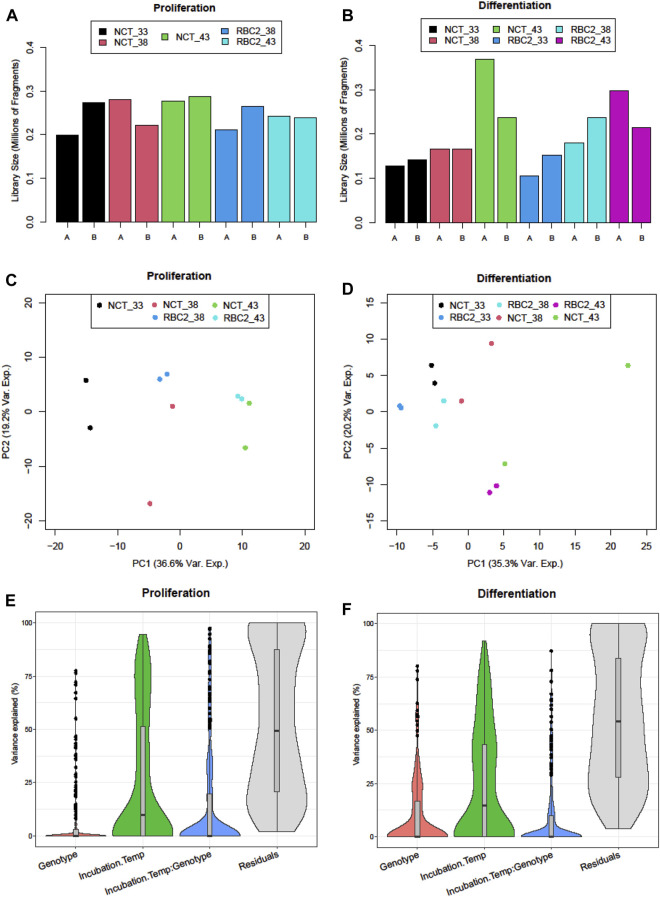
Distribution of sequencing reads (millions of fragments) in sequencing libraries of treatment groups of (A) proliferating and (B) differentiating muscle satellite cells. PCA plots of normalized read counts for (C) proliferating and (D) differentiating satellite cells. Sample-to-sample distances (within and between treatments) are illustrated for each treatment sample on the first two principal components. The samples are plotted according to the treatment. The distribution of sample variance by the treatment factor: genotype (line), temperature, interaction, and residual for (E) proliferating and (F) differentiating satellite cells.

