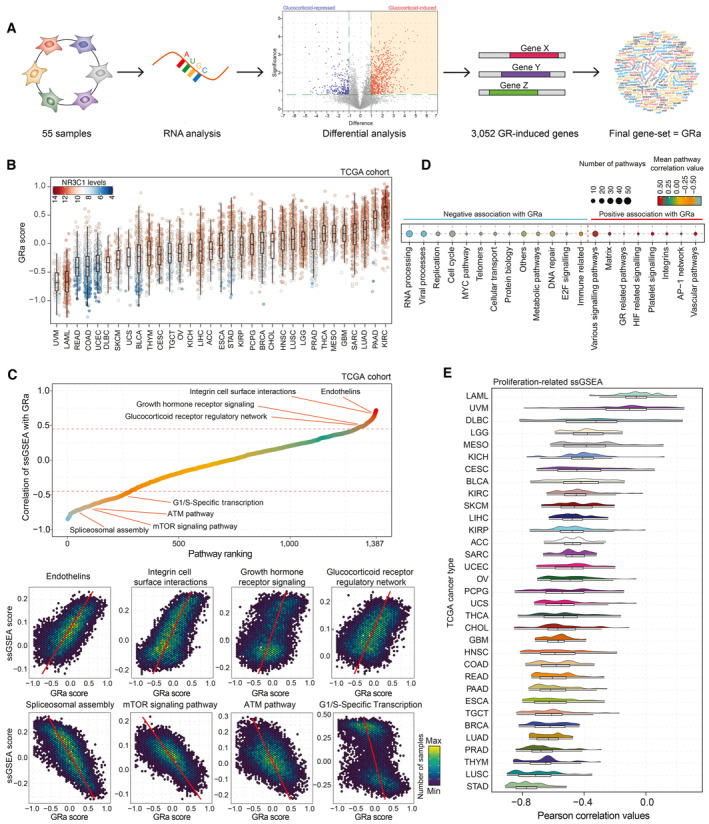
Schematic representation of GR activity signature development.
GR activity calculations for sample of the TCGA cohort (n = 9,874) split by cancer type. Color of each data point represents NR3C1 mRNA levels (red, white, and blue represent high, intermediate, and low levels, respectively). The box begins in the first quartile (25%) and ends in the third (75%), while the line represents the median value. The lines represent segments to furthest data without accounting for outliers.
(top) Correlation analysis of single‐sample gene‐set enrichment analysis (ssGSEA) scores calculated per TCGA sample (n = 9,829), and GR activity, with several top pathways highlighted. (bottom) Pearson correlation plots depicting pathway scores and GR activity for pathways highlighted in the panel above. Each hex represents a group of patients with similar values, and the color of the hex represents how many samples fall into that particular space.
Significantly correlating single‐sample GSEA families (number of pathways grouped is reflected by the point size) with the average correlation with GR activity signature reported as a color gradient. Only pathway families with strong Pearson correlation are displayed (R < −0.45 or > 0.45).
Distribution of Pearson correlation values for all the proliferation‐related ssGSEA signatures and GR activity for each TCGA tumor type independently. Under the distribution graph, a boxplot is depicted. The box itself spans from the first quartile (25%) to the third quartile (75%), representing the interquartile range where the central 50% of data values fall. Inside the box, a line denotes the median value. The whiskers of the boxplot extend from the ends of the box to the minimum and maximum values.