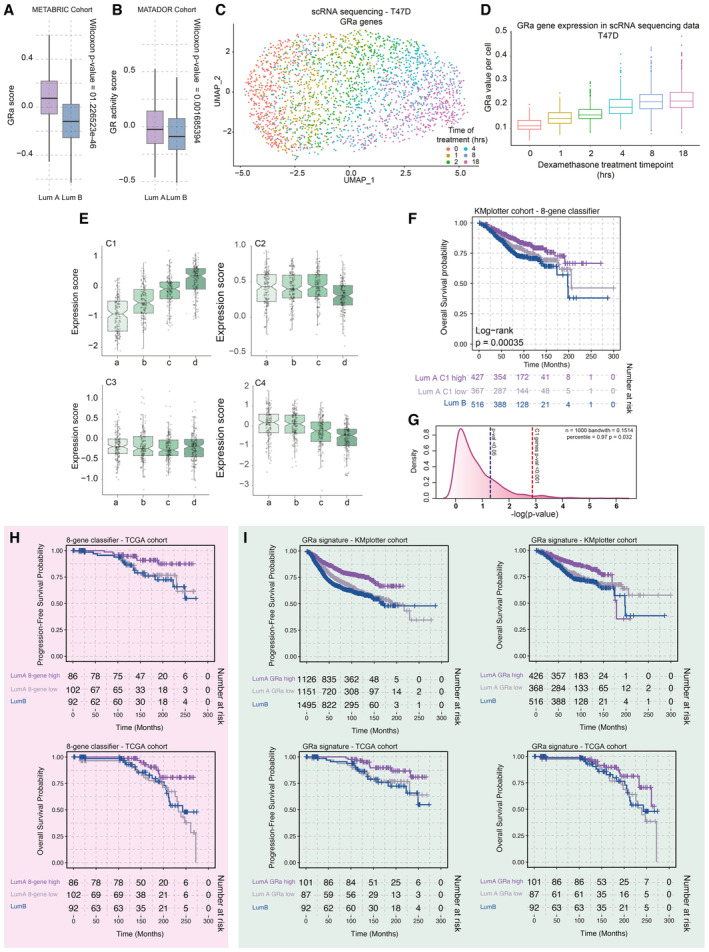
Boxplots depicting GR activity signature in Luminal A and B cancers of the METABRIC cohort (n = 1,134 luminal samples). The box begins in the first quartile (25%) and ends in the third (75%), while the line represents the median value. The lines represent segments to furthest data without accounting for outliers. P‐values were determined by the Wilcoxon t‐test.
Boxplots depicting GR activity signature in Luminal A and B cancers of the MATADOR trial (n = 415 luminal samples). P‐values were determined by the Wilcoxon t‐test. The box begins in the first quartile (25%) and ends in the third (75%), while the line represents the median value. The lines represent segments to furthest data without accounting for outliers.
The UMAP analysis of time‐course experiments performed with T47D cell line utilizing the GRa genes. Each cell is colored according to the treatment time points—0, 1, 2, 4, 8, and 18 h.
Boxplot depicting the value of GR activity per cell per time point of the time course (400 cells). The central mark indicates the median, and the bottom and top edges of the box indicate the 25th and 75th percentiles, respectively. The lines represent segments to furthest data without accounting for outliers.
Average gene expression of genes corresponding to clusters identified by k‐means clustering of PAM50 genes in luminal breast cancer patient samples. The box begins in the first quartile (25%) and ends in the third (75%), while the line represents the median value. The lines represent segments to furthest data without accounting for outliers.
Overall survival probabilities of breast cancer patients (n = 1,310) grouped by transcriptomics‐based 8‐gene classifier (Luminal A high expression = purple, Luminal A low expression = gray, and Luminal B = blue). Overall survival probabilities in months are plotted for each group, and censored patients are shown as vertical tick marks.
Prognostic power as determined by SigCheck of the 8‐gene classifier (red dotted line) with 1,000 random gene sets of the same size (P‐value < 0.05 is indicated by the blue dotted line) for overall survival parameter in KMplotter breast cancer cohort (n = 1,310).
Overall survival probabilities of breast cancer patients (TCGA cohort n = 280) grouped by transcriptomics‐based 8‐gene classifier (Luminal A high expression = purple, Luminal A low expression = gray, and Luminal B = blue). Overall survival probabilities in months are plotted for each group, and censored patients are shown as vertical tick marks. First 300 months were included in the analysis.
Overall survival probabilities of breast cancer patients (KMplotter cohort n = 3,772; TCGA cohort n = 280) grouped by GR activity signature (Luminal A high expression = purple, Luminal A low expression = gray, and Luminal B = blue). Overall survival probabilities in months are plotted for each group, and censored patients are shown as vertical tick marks. First 300 months were included in the analysis.