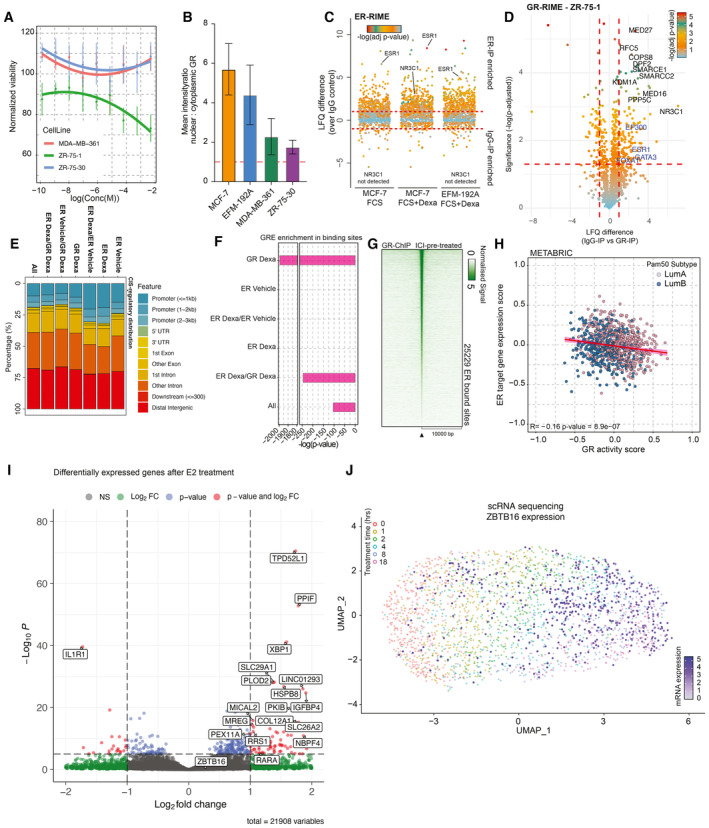
Figure EV4. Molecular aspect of GR signaling in luminal breast cancer.

- Normalized cancer cell viability (lines depict polynomial fit) in response to GR agonist (Dexa) treatment. n = 4. Mean values ± SEM depicted.
- Bar plot depicting nuclear‐to‐cytoplasmic ratio of GR in various cell lines. n = 3. Mean values ± SEM depicted.
- Jitter plot depicting differentially enriched interactors in ER‐RIME experiments between Veh‐treated MCF‐7 and Dexa‐treated MCF‐7 and EFM‐192A cell lines. n = 4. P‐values were determined by two‐sided t‐test.
- Volcano plot depicting enriched (in comparison to IgG‐IP control) interactors in GR‐RIME experiments in ZR‐75‐1 cell line. n = 3. P‐values were determined by two‐sided t‐test.
- Genomic distribution analyses for all the sites detected in ChIP‐sequencing experiments. n = 3.
- HOMER motif analysis of P‐value for GREs across different categories of sites.
- Heatmap of ChIP‐sequencing signal for GR around peak midpoint for all sites detected across the genome after 24 h pre‐treatment with ICI and subsequent 2 h treatment with Dexa. n = 3.
- Scatterplot depicting the absence of correlation of GR activity with ER target gene expression in luminal breast cancers.
- Volcano plot depicting transcriptomic differences between DCC‐treated and DCC+E2‐treated MCF‐7 (n = 4). Adjusted P‐values were determined by DESeq2 (Wald test P‐values corrected for multiple testing using Benjamini and Hochberg method).
- The UMAP analysis of time‐course experiments performed with T47D cell line utilizing the GRa genes. Each cell is colored according to the treatment time points—0, 1, 2, 4, 8, and 18 h, and the values of ZBTB16 gene expression are projected on top (white‐to‐blue gradient).
Data information: All experiments were performed in biological replicate and the number (n) of replicates indicated.
