
Figure EV5. ZBTB16 action in ER‐positive breast cancer.
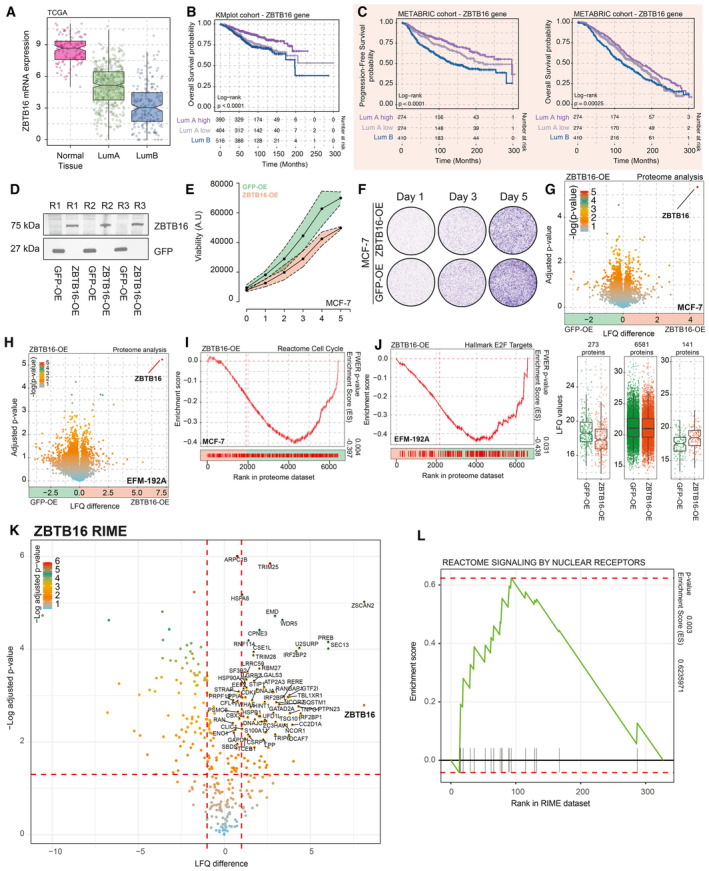
- Boxplot depicting ZBTB16 mRNA expression in normal breast tissues, Luminal A, as well as Luminal B cancer samples (TCGA cohort n = 702). The box begins in the first quartile (25%) and ends in the third (75%), while the line represents the median value. The lines represent segments to furthest data without accounting for outliers.
- Overall survival probabilities of breast cancer patients (KMplotter meta dataset; n = 1,310) grouped by ZBTB16 mRNA expression (Luminal A high expression = purple, Luminal A low expression = gray, and Luminal B = blue). Overall survival probabilities in months are plotted for each group, and censored patients are shown as vertical tick marks.
- Progression‐free and overall survival probabilities of breast cancer patients (METABRIC dataset) grouped by ZBTB16 mRNA expression (Luminal A high expression = purple, Luminal A low expression = gray, and Luminal B = blue). Progression‐free and overall survival probabilities in months are plotted for each group, censored patients are shown as vertical tick marks.
- Western blot showing expression of V‐5‐tagged GFP and ZBTB16. n = 3.
- Normalized cancer cell viability for MCF‐7 GFP (green) and ZBTB16 (orange) overexpression models. n = 4.
- Representative crystal violet assay image for MCF‐7 GFP and ZBTB16 overexpression models. n = 3.
- Upper panel, volcano plot depicting differences in protein expression between GFP‐OE and ZBTB16‐OE models in MCF‐7 cells. Significance is depicted as a color gradient; lower panel, intensity (LFQ) values per category (decrease in expression, same levels, and increase in expression upon ZBTB16 overexpression). n = 4. The box begins in the first quartile (25%) and ends in the third (75%), while the line represents the median value. The lines represent segments to furthest data without accounting for outliers.
- Volcano plot depicting differences in protein expression between GFP‐OE and ZBTB16‐OE models in EFM‐192A cells. n = 4.
- Reactome cell cycle (gene‐set reference: R‐HSA‐1640170) GSEA enrichment profiles based on whole‐proteome data comparison between GFP‐OE and ZBTB16‐PE in MCF‐7 cell line.
- Hallmark E2F targets (gene‐set reference: M5925) GSEA enrichment profiles based on whole‐proteome data comparison between GFP‐OE and ZBTB16‐PE in EFM‐192A cell line.
- Volcano plot depicting differentially enriched (over IgG control) interactors in ZBTB16‐RIME experiments in MCF‐7 cells. n = 4. P‐values were determined by two‐sided t‐test.
- GSEA enrichment profiles for “Reactome Signaling by nuclear receptors” gene sets based on IgG versus ZBTB‐16 RIME comparison (n = 4).
Data information: All experiments were performed in biological replicates and the number (n) of replicates indicated.