
Figure EV6. Inhibition of epigenetic pathways in additional models of breast cancer.
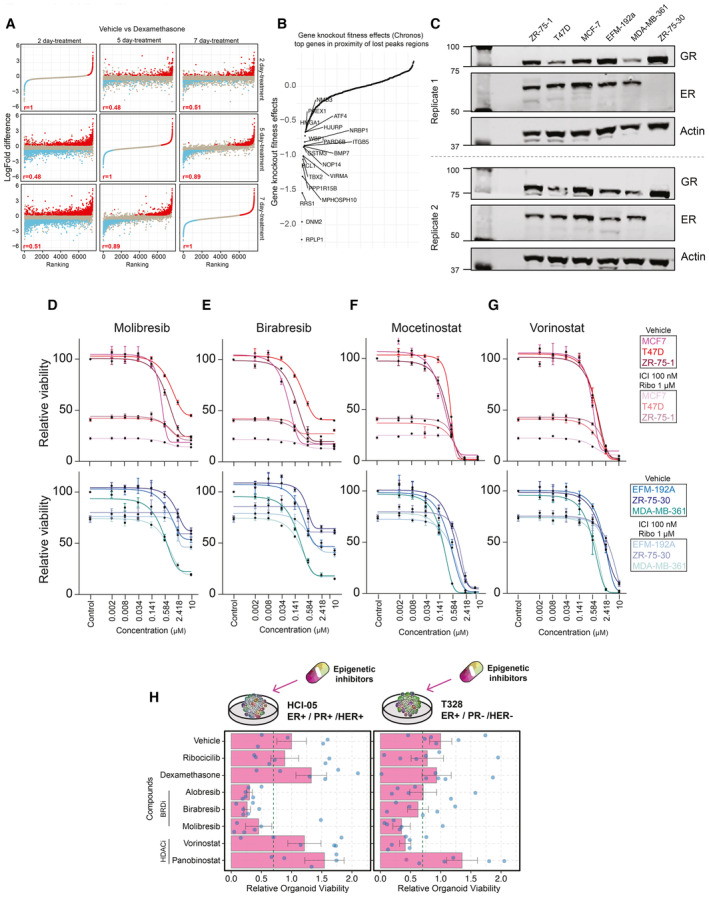
- Comparison of Dexa‐induced proteomic changes in proteomics experiments across different time points (2‐ vs. 5‐ vs. 7‐day treatment). n = 4. Adjusted P‐values (Padj) were determined by t‐test (P‐values corrected for multiple testing using Benjamini and Hochberg method). Pearson correlation value is reported.
- Snake plot depicting the gene knockout fitness effects (Chronos) for top genes potentially regulated by vehicle unique H3K27Ac sites.
- Western blot showing expression of GR and ER in all the breast cancer cell line models used in the manuscript, with actin as a loading control (n = 2).
- Normalized cancer cell viability in response to BRD inhibitor (Molibresib) treatment. n = 4.
- Normalized cancer cell viability in response to BRD inhibitor (Birabresib) treatment. n = 4.
- Normalized cancer cell viability in response to HDAC inhibitor (Mocetinostat) treatment. n = 4.
- Normalized cancer cell viability in response to HDAC inhibitor (Vorinostat) treatment. n = 4.
- Bar chart showing response to various inhibitors for each of the organoid lines alongside key tumor characteristics. Drug concentrations (dexamethasone 100 nM, ribociclib 1,000 nM, alobresib 100 nM, birabresib 500 nM, vorinostat 500 nM, panobinostat 10 nM, and molibresib 500 nM). Error bars represent mean ± SEM. n = 6.
Data information: All experiments were performed in biological replicates and the number (n) of replicates indicated.