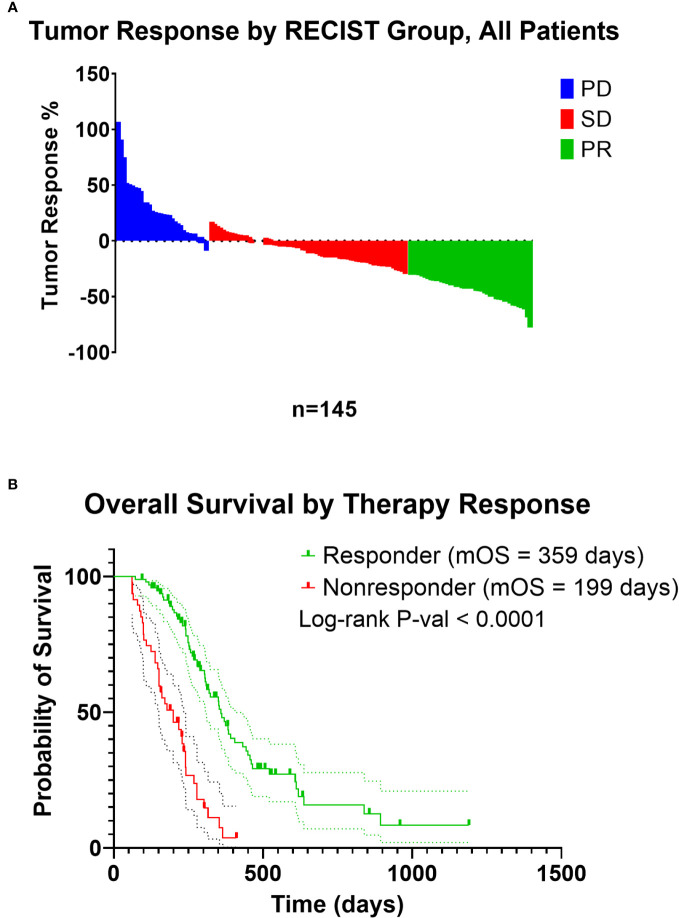
Figure 1.
(A) Waterfall plot of tumor response of patients included in the analysis from the COMPASS trial. Patients were recoded from PD (Progressive Disease), SD (Stable Disease), and PR (Partial Response) to those with a decrease in tumor size on treatment as “responders”, and patients with an increase in tumor size on treatment as “nonresponders”. (B) Kaplan-Meier estimate of responders and nonresponders.

