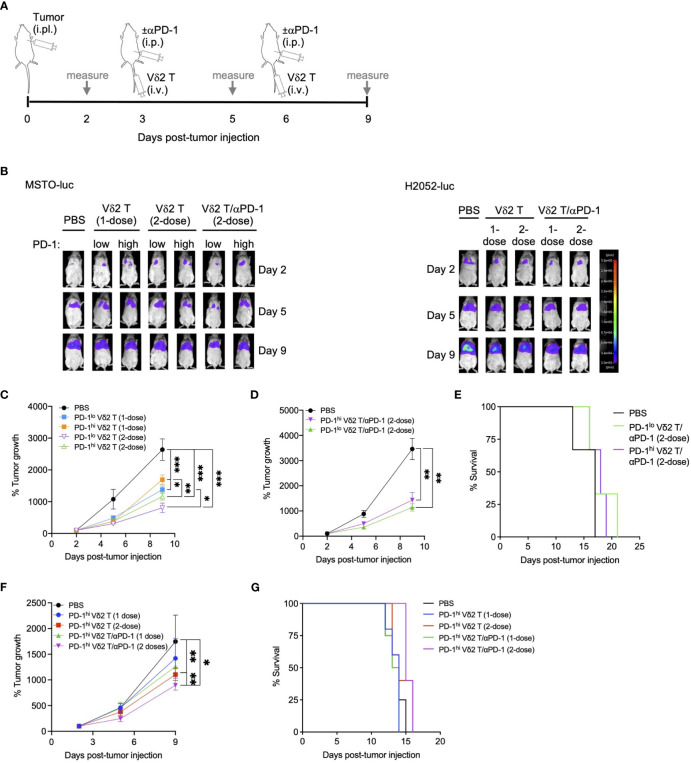
Figure 2.
Vδ2 T cells and anti-PD-1 retard mesothelioma tumor growth in vivo. (A) Timeline of both MSTO-luc and H2052-luc mice experiment indicating the day for cell or αPD-1 injection, or measuring tumor size based on luciferase activity in tumor bearing mice. (B) Representative images of luciferase activities of MSTO-luc and H2052-luc bearing mice receiving PD-1lo Vδ2 T with or without αPD-1 at 1-dose or 2-dose regimen. PBS injection served as control. (C, D) Tumor growth measured by luciferase activities over time compared to day 2 post MSTO-luc tumor injection for different treatment groups. Each group contains 3 to 6 mice. (E) Kaplan-Meier plot for MSTO-luc mice receiving 2-dose of PD-1lo or PD-1hi Vδ2 T with αPD-1 over time. (F) Tumor growth of H2052-luc mice receiving one or two doses of PD-1hi Vδ2 T with or without αPD-1 over time, with survival as Kaplan-Meier plot (G). Each group contains 4-5 mice. Data represents mean ± SEM. Two-way ANOVA statistical test was used for analyzing tumor growth curves. *P< 0.05, **P< 0.01, ***P< 0.001.

