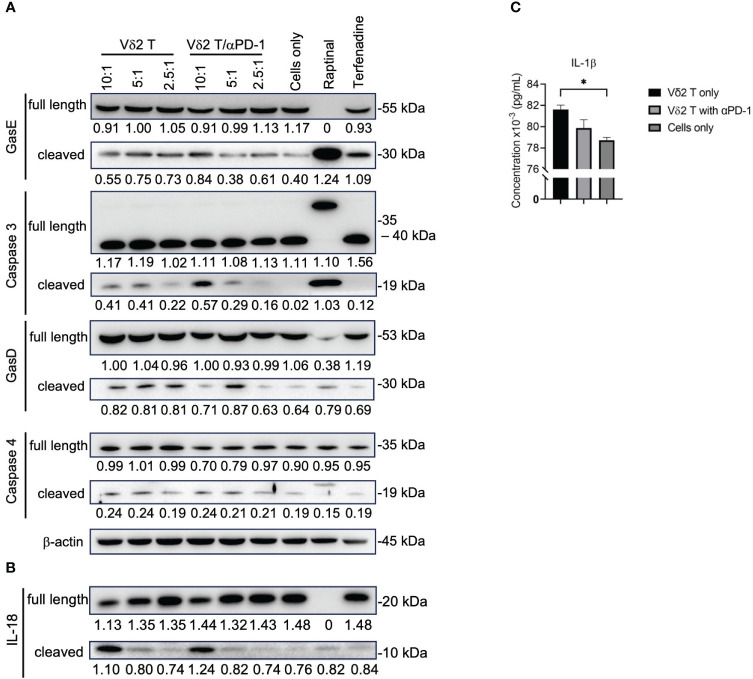
Figure 4.
Vδ2 T cells induce pyroptosis in mesothelioma cells. (A) Analysis of protein expression level of gasdermin (Gas)E, caspase 3, GasD, caspase 4, and (B) IL-18, following 6 h of co-culture between Vδ2 T cells and MSTO-luc. Controls include raptinal and terfenadine, or cells only. Arrows indicate expected band size of the full-length or cleaved proteins. Numbers under the bands represent band intensity normalized to β-actin. Representative immunoblots are shown. (C) ELISA analysis of IL-1β release following 6 h of co-culture between Vδ2 T cells and MSTO-luc at 10:1 ratio. plotted as a column graph of mean ± SEM. Data from three independent experiments are shown. One-way ANOVA statistical test was used. *P< 0.05.

