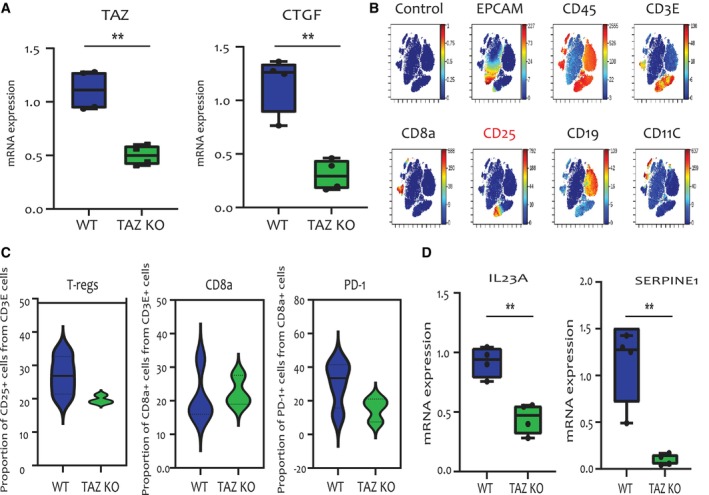
Fig. 5.

Cytometry by time of flight (CyTOF) analysis of TAZ‐deficient vs. TAZ‐proficient tumours. (A) Relative levels of TAZ and CTGF mRNA in EPCAM‐positive cells isolated from wild‐type (WT) tumours (n = 4) and TAZ‐knockout (KO) tumours (n = 3), measured by RT‐qPCR. Error bars indicate mean ± SEM from all repeats. **P < 0.01, Unpaired T‐test. (B) Clustering analysis of immune cell populations performed on CyTOF data from a representative sample. Unique cell populations are identified by the markers shown above each graph. (C) Relative proportion of Tregs, CD8+ T cells and PD‐1‐positive CD8+ T cells in WT (n = 4) and TAZ KO tumours (n = 3), analysed using Gating Editor in Cytobank [74]. (D) Relative levels of IL23A and SERPINE1 mRNA in the same EPCAM‐positive cells as in (A), determined by RT‐qPCR. Error bars indicate mean ± SEM from all repeats. **P < 0.01, Unpaired T‐test. CTGF, Connective tissue growth factor; Il23, Interleukin 23; SerpinE1, Plasminogen activator inhibitor 1.
