Fig. 2.

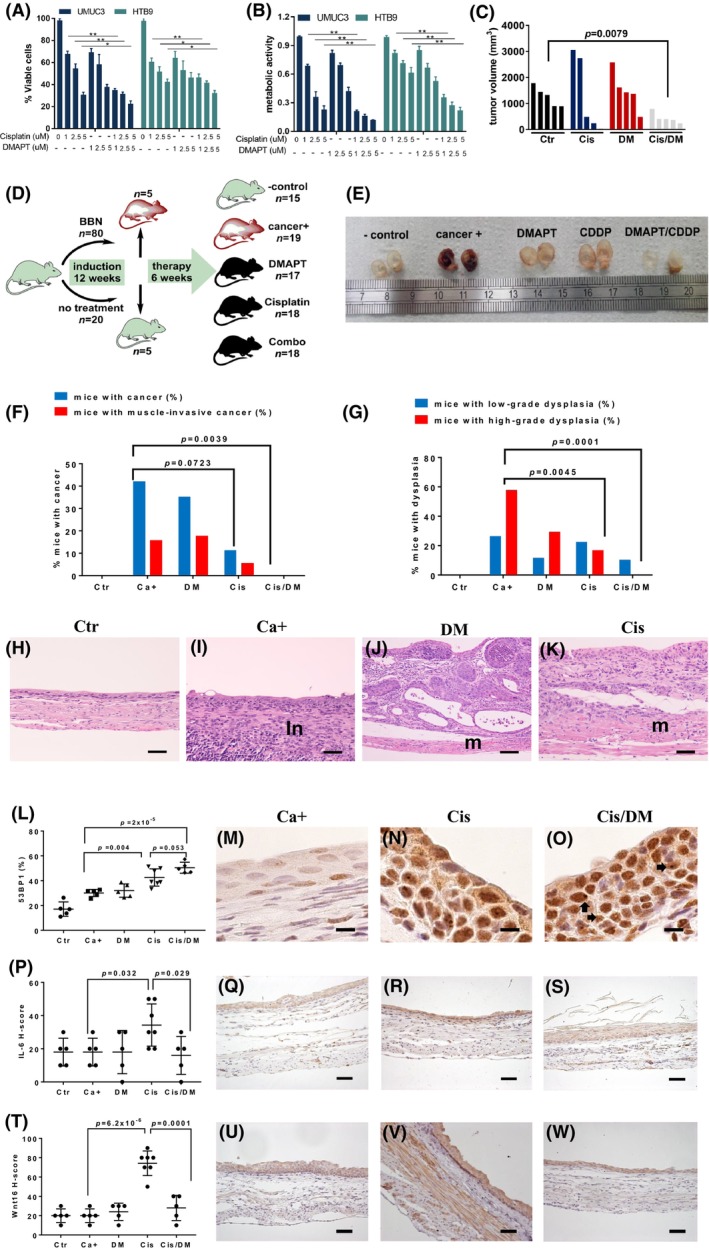
Dimethylaminoparthenolide (DMAPT) augments platinum activity against urothelial carcinoma. (A) In vitro HTB9 and UMUC3 cell viability (average ± standard deviation) using a Trypan blue exclusion assay in the presence of cisplatin, DMAPT, and their combinations, at 72 h (n = 3 replicas per experimental condition), *P < 0.05, **P < 0.001 using unpaired two‐tailed Student's t tests. (B) In vitro HTB9 and UMUC3 cell metabolic activity (average ± standard deviation) in the presence of cisplatin, DMAPT, and their combination, at 72 h, using a 3‐(4,5‐dimethylthiazol‐2‐yl)‐2,5 diphenyl tetrazolium bromide (MTT) assay (n = 3 replicas per experimental condition), **P < 0.001 using unpaired two‐tailed Student's t tests. (C) Tumor volume of xenografts formed by UMUC3 cells in nude mice 12 days after starting the treatment. Mice in each group received saline (Ctr, n = 5), 5.0 mg·kg−1 cisplatin i.p. weekly (Cis, n = 4), 100.0 mg·kg−1 oral daily (DM, n = 5), or their combination (Cis/DM, n = 5). Differences were analyzed using unpaired two‐tailed Student's t tests. (D) Schematic representation of the N‐butyl‐N‐(4‐hydroxybutyl)‐nitrosamine (BBN) experiment. Mice received BBN for 12 weeks, after which five BBN‐exposed and five control mice were sacrificed to confirm the development of pre‐malignant lesions. Surviving mice were divided into five groups: negative control (Ctr, n = 15), cancer‐positive untreated (Ca+, n = 19), DMAPT (DM, n = 17), cisplatin (Cis, n = 18), and combination (Cis/DM, n = 18), treated for 4 weeks and sacrificed. The n for each experimental group is valid for following panels (E–K); (E) Representative macroscopic view of the bladder following sacrifice, 24 h formalin fixation, and sagittal section (Ctr n = 15, Ca+ n = 19, DM n = 17, Cis, n = 18, and Cis/DM, n = 18). Ruler shows centimeters. (F) Percentage of mice with urothelial carcinoma (in gray) and with muscle‐invasive urothelial carcinoma (in black) for each experimental group, as determined in hematoxylin and eosin (H&E)‐stained sections (Ctr n = 15, Ca+ n = 19, DM n = 17, Cis, n = 18, and Cis/DM, n = 18). Differences were analyzed using Chi‐square tests. (G) Percentage of mice with low‐grade urothelial dysplasia (in gray) and with high‐grade urothelial dysplasia (in black) for each experimental group, as determined in H&E‐stained sections (Ctr n = 15, Ca+ n = 19, DM n = 17, Cis, n = 18, and Cis/DM, n = 18). Differences were analyzed using Chi‐square tests. (H–K) Representative H&E images (Ctr n = 15, Ca+ n = 19, DM n = 17, Cis, n = 18, and Cis/DM, n = 18) of: normal bladder from the Ctr group (H) (100×, bar = 100 μm), and high‐grade urothelial dysplasia from the Ca+ group (I) (200×, bar = 50 μm). Note intense inflammatory infiltrate (in) occupying the submucosa and muscularis tunics. Non‐muscle‐invasive urothelial carcinoma from the DM group (J) (100×, bar = 100 μm). Note intact muscularis tunic (M). (K) Muscle‐invasive urothelial carcinoma from the Cis group (200×, bar = 50 μm). Note invasion of the muscularis tunic (M); (L–O) Representative images of immunohistochemistry (IHC, n = 5 for Ctr, Ca+, DM, and Cis/DM, n = 7 for Cis) for the DNA damage marker 53BP1, diaminobenzidine (DAB)–Mayer's hematoxylin, 1000× bar = 10 μm. (L) Percentage of positive stromal cells for each experimental group (average ± standard deviation), differences were analyzed with unpaired two‐tailed Student's t tests; (M) Ca+ group, (N) Cis group, and (O) Cis/DM group. Arrows point to 53BP1 foci. (P–S) Representative images of IHC for interleukin‐6 (IL‐6) and DAB–Mayer's hematoxylin, 200× bar = 50 μm (n = 5 for Ctr, Ca+, DM, and Cis/DM, n = 7 for Cis). (P) H‐scores for IL‐6 IHC staining in each experimental group (average ± standard deviation), differences were analyzed with unpaired two‐tailed Student's t tests, (Q) Ca+ group, (R) Cis group. (S) Cis/DM group; (T–W) representative images of IHC for Wnt family member 16 (WNT16), DAB–Mayer's hematoxylin, 200×, bar = 50 μm (n = 5 for Ctr, Ca+, DM, and Cis/DM, n = 7 for Cis). (T) H‐scores for WNT16 IHC staining in each experimental group (average ± standard deviation), differences were analyzed with unpaired two‐tailed Student's t tests, (U) Ca+ group, (V) Cis group, and (W) Cis/DM group.
