Fig. 3.

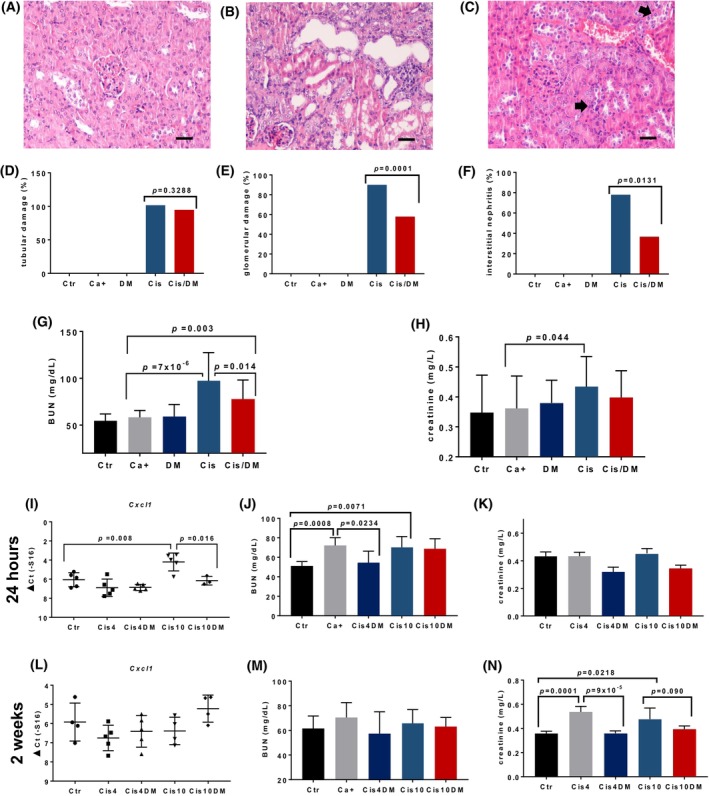
Dimethylaminoparthenolide (DMAPT) ameliorates cisplatin's nephrotoxicity in mice. (A–C) Representative hematoxylin and eosin (H&E) images of renal tissues (400×, bars = 20 μm) from: (A) Ctr group (n = 15) showing normal kidney histology; (B) Cis group (n = 18) showing tubular degeneration and interstitial nephritis; and (C) Cis/DM group (n = 18) showing preserved renal histology, with multifocal karyomegaly (arrows). Panels (D–H) show further data from all groups in the N‐butyl‐N‐(4‐hydroxybutyl)‐nitrosamine (BBN) experiments: (Ctr, n = 15), cancer‐positive untreated (Ca+, n = 19), DMAPT (DM, n = 17), cisplatin (Cis, n = 18), and combination (Cis/DM, n = 18). (D–F) Percentages of animals in each group (Ctr n = 15, Ca+ n = 19, DM n = 17, Cis, n = 18, Cis/DM, n = 18) showing (D) tubular degeneration/necrosis, (E) membranous or proliferative glomerulonephritis, and (F) interstitial nephritis. Differences were analyzed using Chi‐square tests. (G, H) Blood urea–nitrogen (BUN) and creatinine concentrations (average ± standard deviation) on experimental groups (Ctr n = 15, Ca+ n = 19, DM n = 17, Cis, n = 18, Cis/DM, n = 18). Differences were analyzed using analysis of variance (ANOVA). The acute toxicity of a single cisplatin dose (4 or 10 mg·kg−1) over renal tissues was then studied at 24 h (I–K) and 2 weeks (L–N) post‐administration. (I) Gene expression (average ± standard deviation) of Cxcl1 for each experimental group at 24 h (Ctr—negative control, Cis4—4 mg·kg−1 cisplatin, Cis4DM—4 mg·kg−1 cisplatin and 100 mg·kg−1·day−1 DMAPT, Cis10–—10 mg·kg−1 cisplatin, and Cis10DM—10 mg·kg−1 cisplatin and 100 mg·kg−1·day−1 DMAPT, n = 5 per group); differences were analyzed with unpaired two‐tailed Student's t tests. (J, K) Blood urea and creatinine concentrations for each group (Ctr‐negative control, Cis4—4 mg·kg−1 cisplatin, Cis4DM—4 mg·kg−1 cisplatin and 100 mg·kg−1·day−1 DMAPT, Cis10—10 mg·kg−1 cisplatin, Cis10DM—10 mg·kg−1 cisplatin and 100 mg·kg−1·day−1 DMAPT, n = 5 per group, average ± standard deviation), respectively. Differences were analyzed using analysis of variance (ANOVA). (L) Cxcl1 gene expression (average ± standard deviation) for each group at 2 weeks (Ctr—negative control n = 4, Cis4—4 mg·kg−1 cisplatin n = 5, Cis4DM—4 mg·kg−1 cisplatin and 100 mg·kg−1·day−1 DMAPT n = 5, Cis10—10 mg·kg−1 cisplatin n = 4, Cis10DM—10 mg·kg−1 cisplatin and 100 mg·kg−1·day−1 DMAPT n = 5); differences were analyzed with unpaired two‐tailed Student's t tests. (M, N) Blood urea and creatinine concentrations for each group (Ctr—negative control n = 4, Cis4—4 mg·kg−1 cisplatin n = 5, Cis4DM—4 mg·kg−1 cisplatin and 100 mg·kg−1·day−1 DMAPT n = 5, Cis10—10 mg·kg−1 cisplatin n = 4, Cis10DM—10 mg·kg−1 cisplatin and 100 mg·kg−1·day−1 DMAPT n = 5; average ± standard deviation), respectively. Ctr, Control; Ca+, mice with untreated cancer; DM, DMAPT; Cis, Cisplatin. Differences were analyzed using analysis of variance (ANOVA).
