Fig. 2.

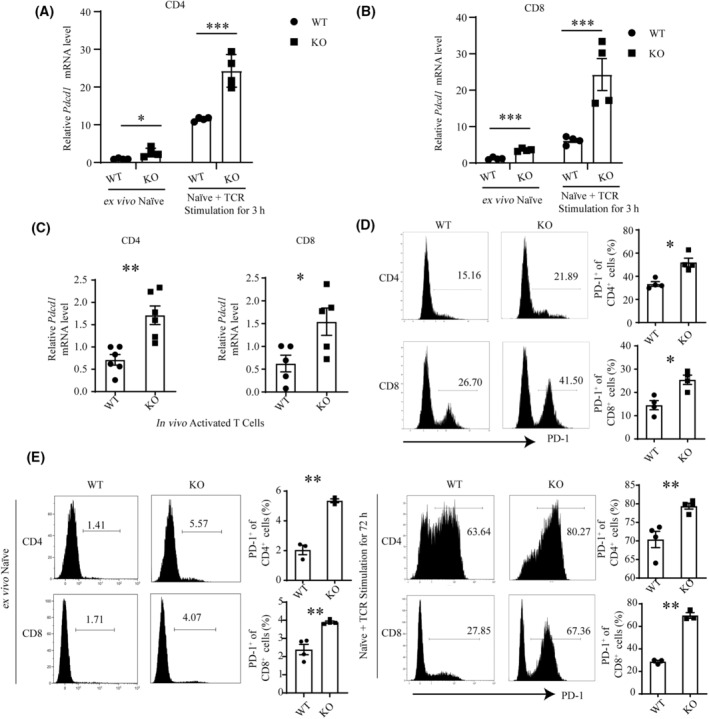
Upregulation of PD‐1 induced by Cbx4 deficiency. (A–C) Relative Pdcd1 mRNA levels in Cbx4‐deficient versus WT (wild‐type). (A) CD4+CD62L+CD44− naïve or TCR‐stimulated (3 h) (n = 4) (B), CD8+CD62L+CD44− naïve or TCR‐stimulated (3 h) (n = 4), (C) and freshly isolated CD44+ effector/memory CD4+ and CD8+ T cells as determined by RT‐qPCR (n = 5). (D, E) PD‐1 protein expression in Cbx4‐deficient versus WT splenic total (D), purified naïve, and TCR‐stimulated (72 h) (n = 4). (E) CD4+ and CD8+ T cells as determined by flow cytometry (n = 3). Representative histograms are shown on the left. Statistical data are presented as Mean ± SE on the right. Each experiment was repeated at least three times. Unpaired t‐test was used for comparison, *P < 0.05, **P < 0.01, ***P < 0.001.
